Weekly – Starting with market internals this week before getting into the broader macro backdrop because of the interest in fading Momentum and Growth factors. The headwinds to Mo and Growth have increased from a Quant point of view. Not a fundamental/earnings point of view (yet). Please read…
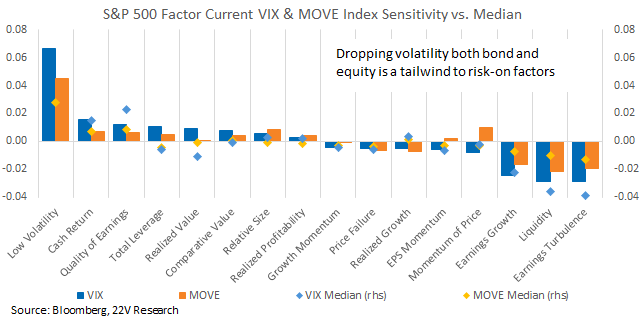
Implied Treasury vol is moved back to its 2024 low, and the VIX has collapsed since the Election. With a stable macro backdrop that is likely going to last for the foreseeable future (more below), vol should stay low. Historically, volatility declines, like we have seen over the past year, are a tailwind to Risk-on and Growth factors as they have the most negative beta to implied vol. Risk-off factors struggle as vol declines. Bottom line, the boost to Growth/Momentum and risk-on factors SHOULD fade with the decline in vol likely over.
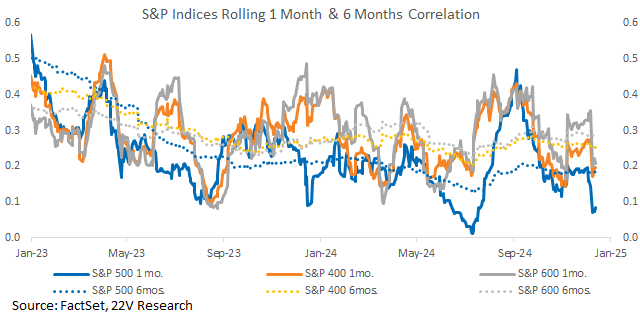
Consistent with the decline in vol, S&P short term intra portfolio correlation dropped sharply as well the past few weeks. Correlations increased after the election as everything rallied (risk-on, growth, Mo) or faded (Low Vo) together. Today, S&P 1 month correlation stands at an unusually low level (4th %tile). That implies better risk taking, higher return dispersion across stocks, and a better backdrop for stock picking.
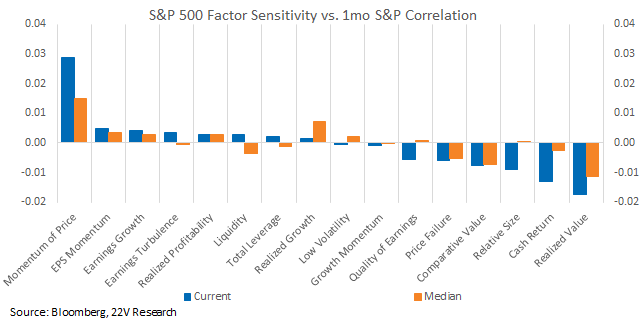
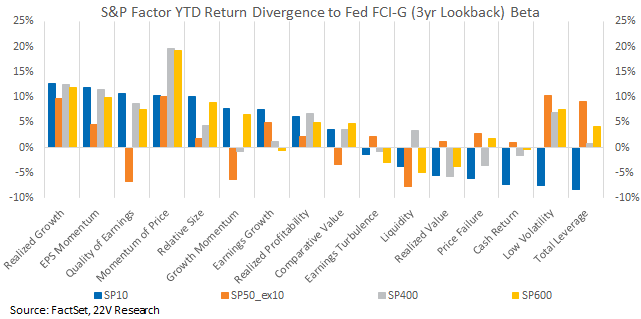
The factor with the highest beta to short term correlation is Price Momentum. That helps explain the sharp drop in Price Mo recently. Growth has positive beta to correlations as well. If some surprise led to an increased in correlations, some recovery of extremely low short-term correlations would be a tailwind for Momentum and Growth. Value factors and Size likely benefit if short term correlation drops further from here. As the Quant team highlighted (HERE), Growth and Momentum (fundamental and price) and Low Vol have significantly outperformed the easing of financial conditions.
Bottom line – even if the macro backdrop hasn’t changed, the extreme PE spreads in Growth/Momentum combined with the fading tailwind from declining volatility and higher correlations, and the unusual outperformance of Mo/Growth vs financial conditions, some give back should not be unexpected.
We think a more significant rotation out of Mo, Growth and Large caps, relative to Small, Value and other laggards will happen in 2025. As the EPS spread between the winning and losing factors of closes in favor of the laggards. We see no reason for winners to not keep winning into year-end. That didn’t look great last week. Yes, headwinds to Mo and Growth have built given lower Vol and lower correlations. But that will only take us so far. Earnings need to show up in the laggards.
We will have more on how to think about Momentum and Growth into the Fed tomorrow. And The rest of the report focuses on the macro backdrop, which favors lower volatility and lower correlations!
US yield curves have steepened over the past two weeks as US economic data has consistently indicated a strong economic expansion AND inflation that is trending toward the ~2-2.5% range. That is very different than a TOO firm economic backdrop with inflation sticking closer to 3%. Recent labor market data (slack increasing but real labor income firm) and CPI/PPI readings (internals dovish, more below) increased the odds the economic expansion can continue at its current pace (GDP is tracking 3.3% in 4Q24) with inflation a NON-ISSUE. Inflation being a non-issue is defined by forward forecasts in the 2-2.5% range for 2025.
Over time, the normal economic expansion should converge to a rate close 2.5% GDP growth, faster than the ~1.5-1.8% in the pre-COVID period. Investors should assume economic growth trending at roughly 2.5% with no major changes in financial conditions for the foreseeable future. Assuming no inflation or government policy shocks. We think the range on 10yr yields is ROUGHLY 4-4.5%ish in a 2.5% real GDP and 2-2.5% core inflationary world.
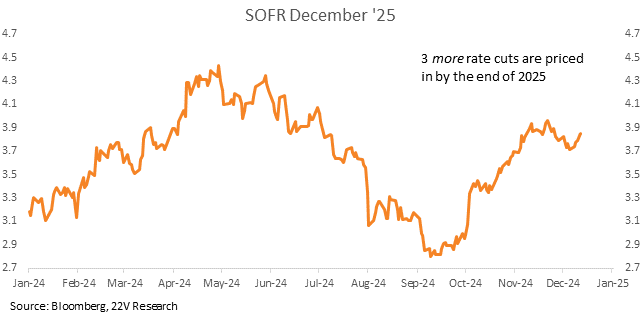
Consistent with the outlook we outlined above, Peter Williams expects the Fed 2025 economic forecast (SEP) to move in an a more optimistic direction with a better unemployment rate and growth outcomes, and a slightly higher inflation path in 2025. The median dot plot will show 3x 25bps cuts in 2025, down from 4x, and with a notable chance of just 2x cuts as the median. The increasing odds of a prolonged firm REAL economic growth is consistent with 10yr yields increasing and Yield Curves steepening last week.
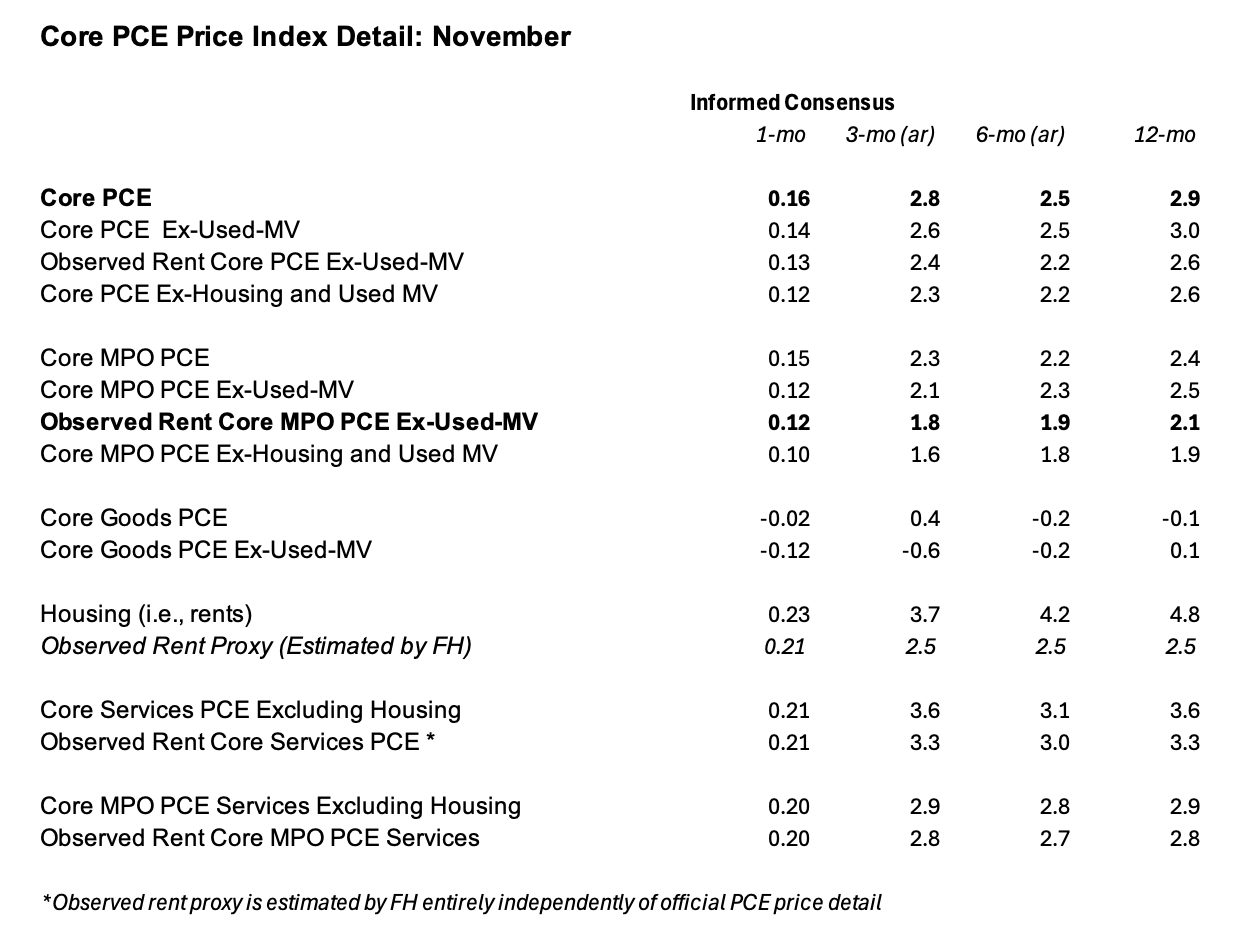
Fade TOO HIGH Inflation Fears: With the details of the CPI/PPI in hand, the informed bean counts into Core PCE (the metric that matters for the Fed and Mon Policy) are fairly benign. IF you use actual rents (defined as market observed rents). Not the lagging govt BLS rent data. Plus, some labor market slack has built up (see urate, employment to population growth slowing some and Unit Labor costs being revised lower).
As Gerard Highlighted (HERE), CPI has little merit in its own right. Almost all that matters is what the individual price details in the CPI say about how the Core PCE Price Index (PCE is the metric the Fed targets) and its underlying detail shape expectations for the Core PCE Price Index and its own underlying detail. And once the PCE prints, the CPI for the same month becomes basically irrelevant. People know this, but they seem to put insufficient weight on it when the CPI prints “hot,” even as it signals a lowish PCE price index. Core CPI has diverged from Core PCE. That will change over time (in favor of lower Core CPI). Fade the CPI RELATED hawkish commentary that claims rate hikes are more likely.
Charts with commentary below…
Indicators: implied Treasury vol is now back to its 2024 low. Implied equity vol has been stable in the low teens, helping lift S&P multiples. So, growth trends are firm, inflation is on a fed-friendly-enough path to support at least some cuts over the next few quarters, which means financial conditions should remain a support for the ongoing economic expansion. All that means low vol should be expected to persist.
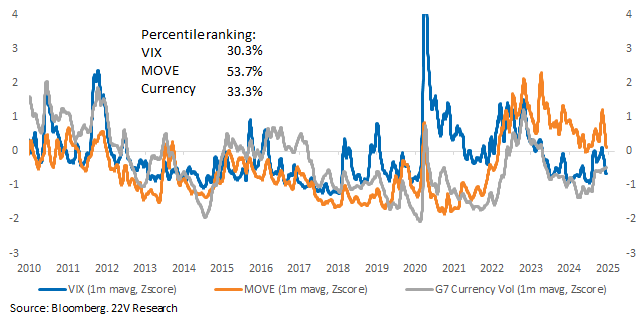
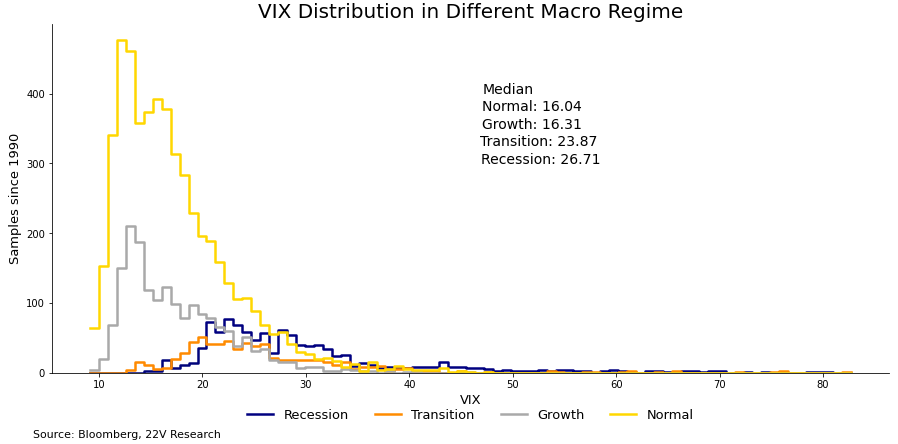
Volatility tends to be lower in Normal expansion periods. For most of this year, the VIX has been sub-15, consistent with the macro backdrop. For several months, inflation-induced Fed policy uncertainty and then typical election-year uncertainty helped lift vol into the high-teens/low 20s. With those issues resolved, the VIX has eased. That helps reinforce our expectation that the Normal regime will continue and that market internals will converge more towards Growth Continuation (HERE).
Low volatility is a tailwind to Risk-on and Growth factors as they have the most negative beta to overall implied vol. Risk-off factors face more headwinds. We expect the post-election risk-on rebound to continue near-term, but the boost to risk-on factors from the decline in vol is likely over. This is another reason to use gains in risk-on factors to fund more fundamentally levered positions. The ongoing economic expansion favors fundamental over risk factors as well.
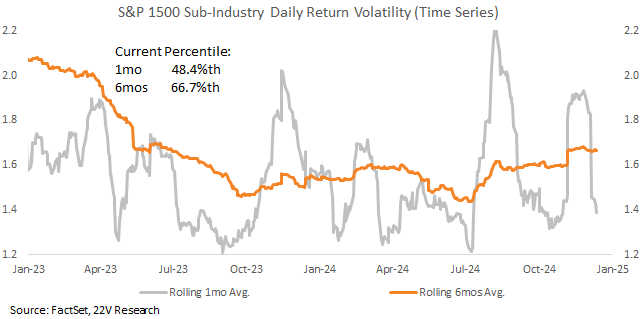
The climbing sub-industry volatility this year (HERE) has also started to fade. 1-month volatility drop of industry groups is back below its median and 6-month volatility is moving lower too. Declining sub-industry volatility confirms the lower volatility at the market level as well as.
Consistent with declining vol, S&P short term intra portfolio correlation dropped sharply as well since the payroll release, and the S&P 1 month correlation is now extremely low (4th %tile). That implies better risk taking, higher return dispersion across stocks, and a better backdrop for stock picking. The relatively low correlation is likely to continue near term on stable growth and easing financial condition backdrop.
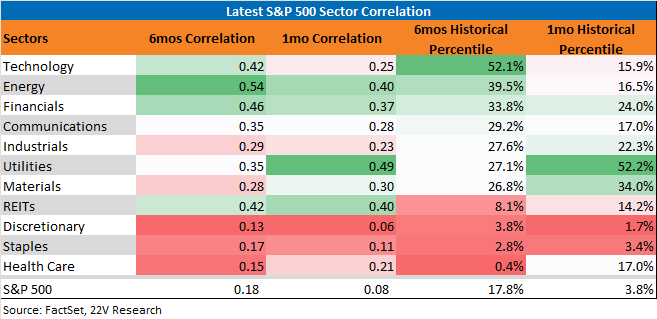
At the sector level, Defensives such as Health Care and Staples, and Discretionary are realizing much lower internal correlations, both short term and long term. While Technology, Energy, and Financials have higher long-term correlations. Utilities are also seeing relatively high correlations near term, suggesting the AI micro theme is still having a heavy influence on the space.
The factor with the highest beta to short term correlation is Price Momentum. That helps explain the sharp drop in Price Mo recently. Some recovery of extremely low short-term correlations would be a tailwind for Momentum and Growth. Value factors and Size have the most negative beta to correlation and are likely to benefit if short term correlation drops further from here.
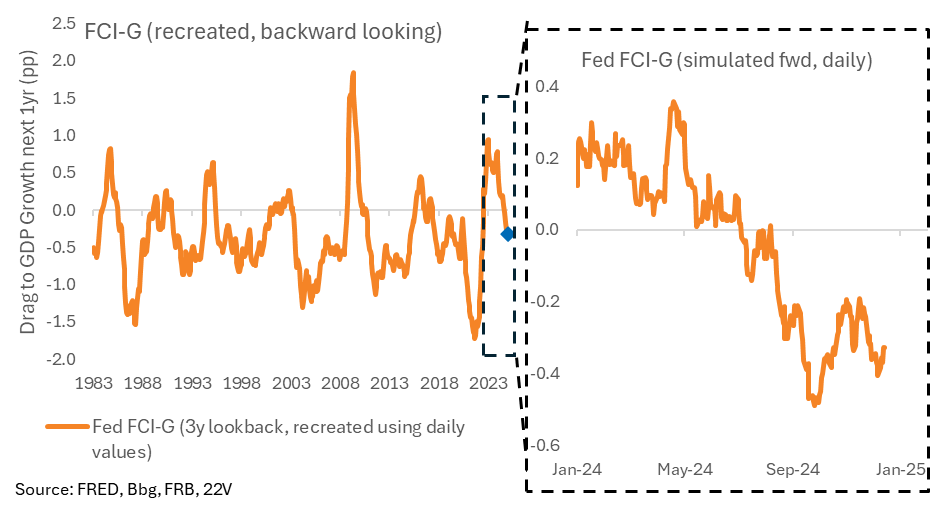
As the Quant team highlighted (HERE), over the medium to longer term, macro data means financial conditions should remain easy, leaving the positive impetus to 2025 GDP in place. Growth and Momentum (fundamental and price) and Low Vol have significantly outperformed the easing of FCI. Again, no macro catalyst short-term into year-end, but longer term this will change.
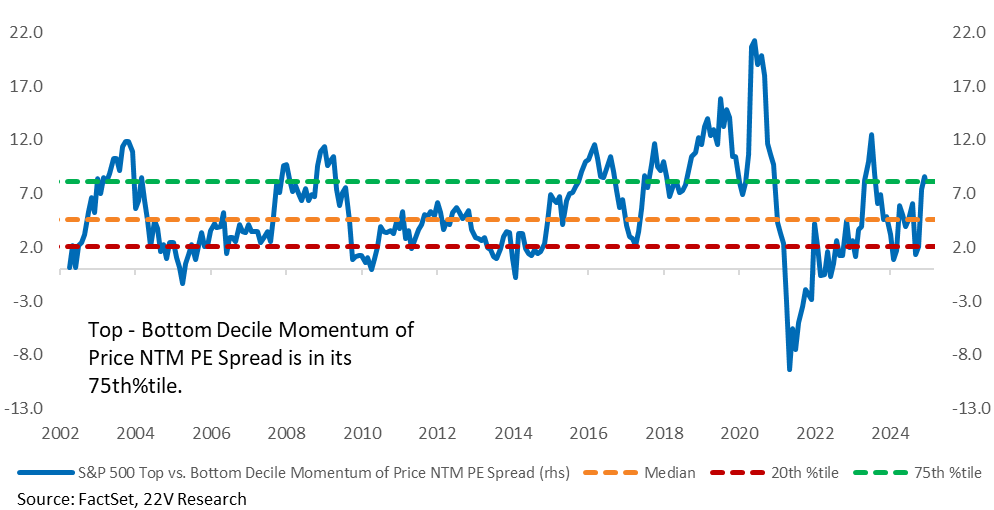
The PE spread of momentum is at its 75th%tile. Momentum has become increasingly more expensive since August.
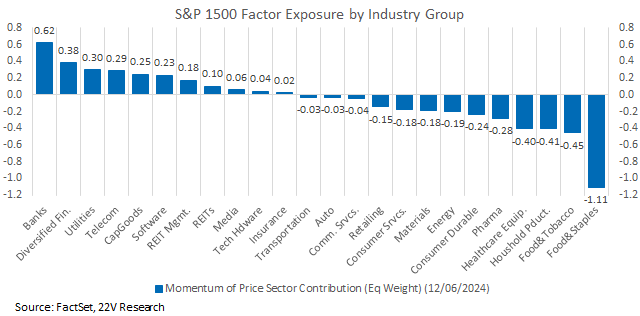
The factor exposure for Momentum is most exposed to Banks and Diversified Financials. It is least exposed to Food & Tobacco and Food & Staples. Banks, diversified financials and Utilities are most at risk.
Top decile growth (companies with the largest growth exposure)’s NTM PE is in its 99.6th%tile after its peak (100th%tile) at the end of November.
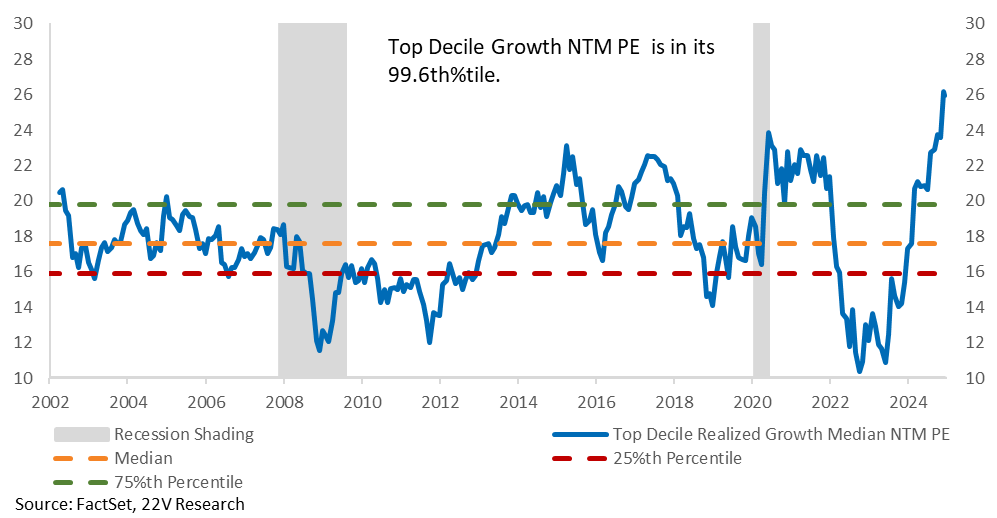
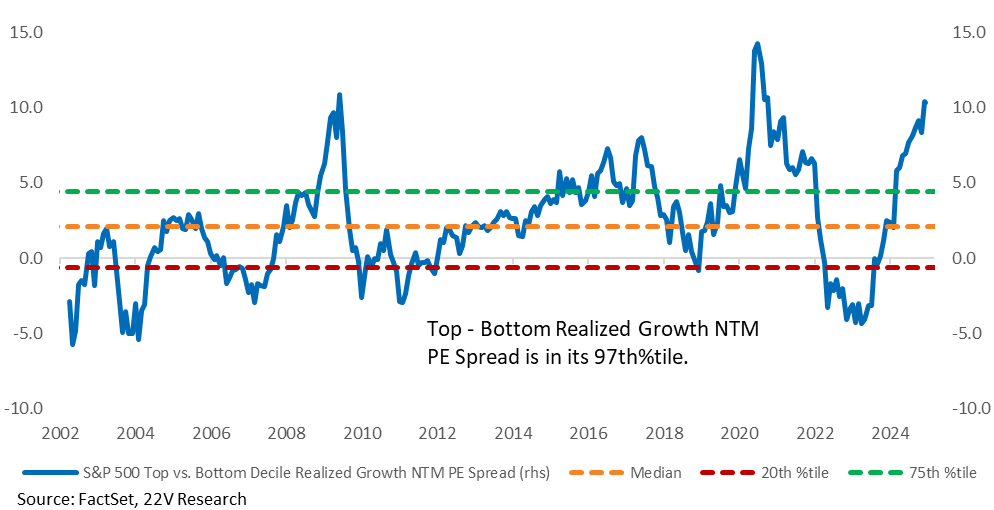
Growth’s PE spread, so high growth relative to low growth stocks, is in its 97th%tile.
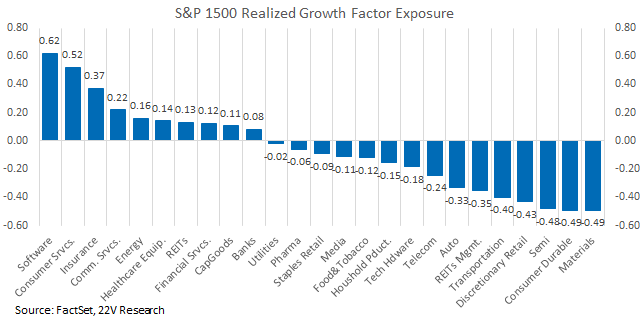
The factor exposure for Growth is most exposed to Software and Consumer Service. It is least exposed to Consumer Durable and Materials. Our long retail vs short consumer services call benefits from a growth unwind. FYI – it is interesting, to us at least, how high the NTM PE for the growth factor is relative to history, but the industry groups that have the highest exposures to the growth factors are many “basic” industries. Outside of Software and Comm Services, Consumer services, Insurance, Energy and Healthcare Equipment have high exposure. Just an observation.
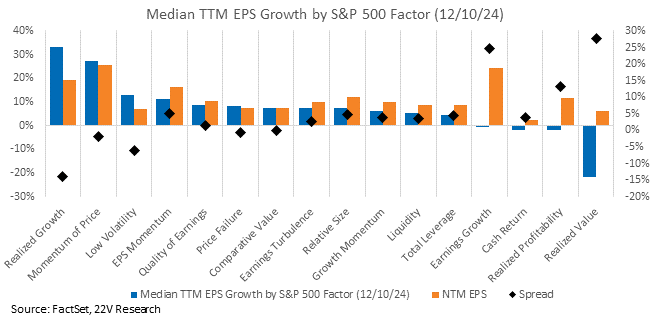
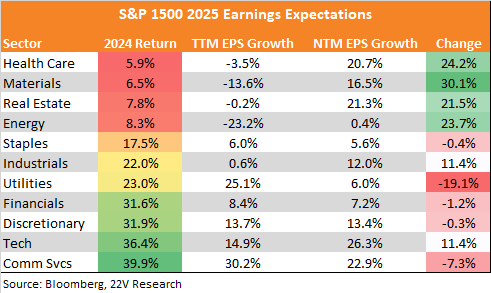
Thinking of 2025 EPS Changes: We expect Growth to stop dominating returns over the medium term. It had an extreme year of realized earnings vs. the rest of the market. Consensus estimates are for Growth to have the largest NTM EPS growth deceleration, with Value having the largest NTM earnings growth acceleration. As/if that change is realized, the pace of Growth returns should slow.
Earnings Changes Into 2025: There’s a similar trend unfolding in sectors too. 2024’s worst EPS growers are expected to have the largest accelerations and the best earners, decelerations. FYI though – Tech is expected to have another great year, bucking this trend.
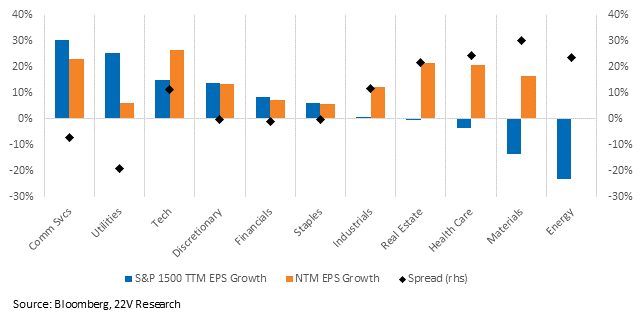
This largely lines up with 2024 price performance. For the most part, the best performers had the highest earnings growth. And that’s expected to flip next year.
Macro Backdrop: US yield curves have steepened over the past week as US economic data has consistently indicated a strong economic expansion AND inflation that is trending toward a Fed-friendly level (~2-2.5%). That is very different than a TOO firm economic backdrop with sticky inflation. The latter scenario would increase the odds the Fed is forced to tighten financial conditions (yield curves flatten). The former scenario means the economic expansion can continue at its current pace (GDP is tracking 3.3% in 4Q24) WHILE inflation continues to move toward the Fed’s ~2% target. The cuts priced into next year are still likely as long as inflation remains in check, even if growth is stronger than expected. Yield curves steepen as 2yr rates are pinned and 10yr moves up some on the firm growth outlook.
If the economy is left alone – meaning no large change to the current supportive financial conditions backdrop, the normal economic expansion will continue at a rate close 2.5% GDP growth vs. ~1.5-1.8% in the pre-COVID period. That should be investors’ working assumption, assuming no inflation or government policy shocks. That is a tailwind for financial assets all things equal. As we think about the rest of the year, we so no reason for current market leadership trends (Growth, Momentum, Mag 7) to change. The Earnings Risk Factor should continue to outperform Low Vol significantly.
With the details of the CPI/PPI in hand, the informed bean counts into Core PCE (the metric that matters for the Fed and Mon Policy) are all benign IF you use actual rents (defined as market observed rents below). Not the lagging govt BLS rent data. The Fed doesn’t even look at the lagging govt data now. Gerard’s preferred measure is bolded below.
Source: BEA, 22V Research
Last week, we hosted an expert call with Leslee King of Real Street Research, who covered the outlook for the retail sector, current trends in the market, and the winners and losers of this holiday season. Replay link HERE. Retail saw a record Black Friday on top of a surprisingly strong Q3. Recall how pessimistic expectations were for holiday shipping heading into the season (intel we got from a different expert call, HERE). The XRT has spiked 5% higher relative to the S&P since the week before Black Friday (7.7% absolute). We favor retail stocks (XRT) on an absolute basis and relative to Consumer Services.
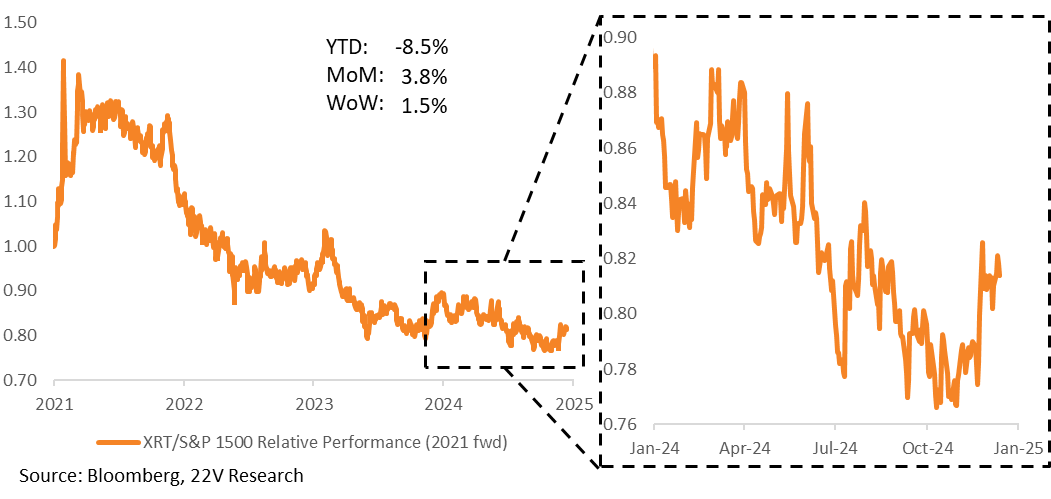
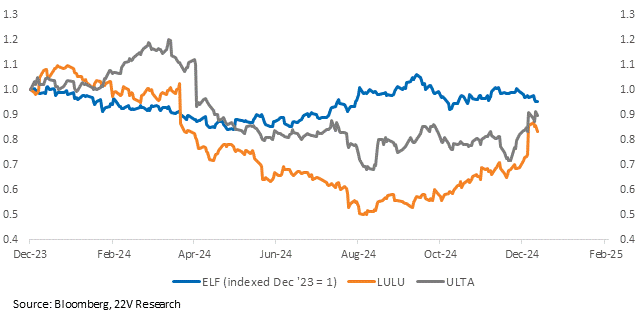
One of the most interesting trends Leslee identified is how well some specialty retailers are doing and the dispersion within them. The industry assumption had been Amazon beating the specialty retailers, collectively. Amazon’s retail business is growing, but retailers are doing well too, though the idio is extremely important here. Specifically, Leslee likes the trends for ELF, and is calling for weakness in fundamentals for LULU and ULTA. That’s especially interesting given the price recovery of LULU and ULTA relative to ELF.