No Pessimism Today: Annual GDP+GDI Benchmark Revisions Resolve Some Major Debates, All in an Optimistic Direction
- It is hard to understate the magnitude, and constructive directional consistency, of these revisions.
- But they do not eliminate the best and primary reason for dovish concern, which is the continued gradual softening in the labor market and the risk that it becomes nonlinear.
- It seems possible, perhaps outright likely, if an impossible to know counterfactual, that if the Fed had had this data in hand 2-4 weeks ago we’d have gotten a 25 and not a 50.
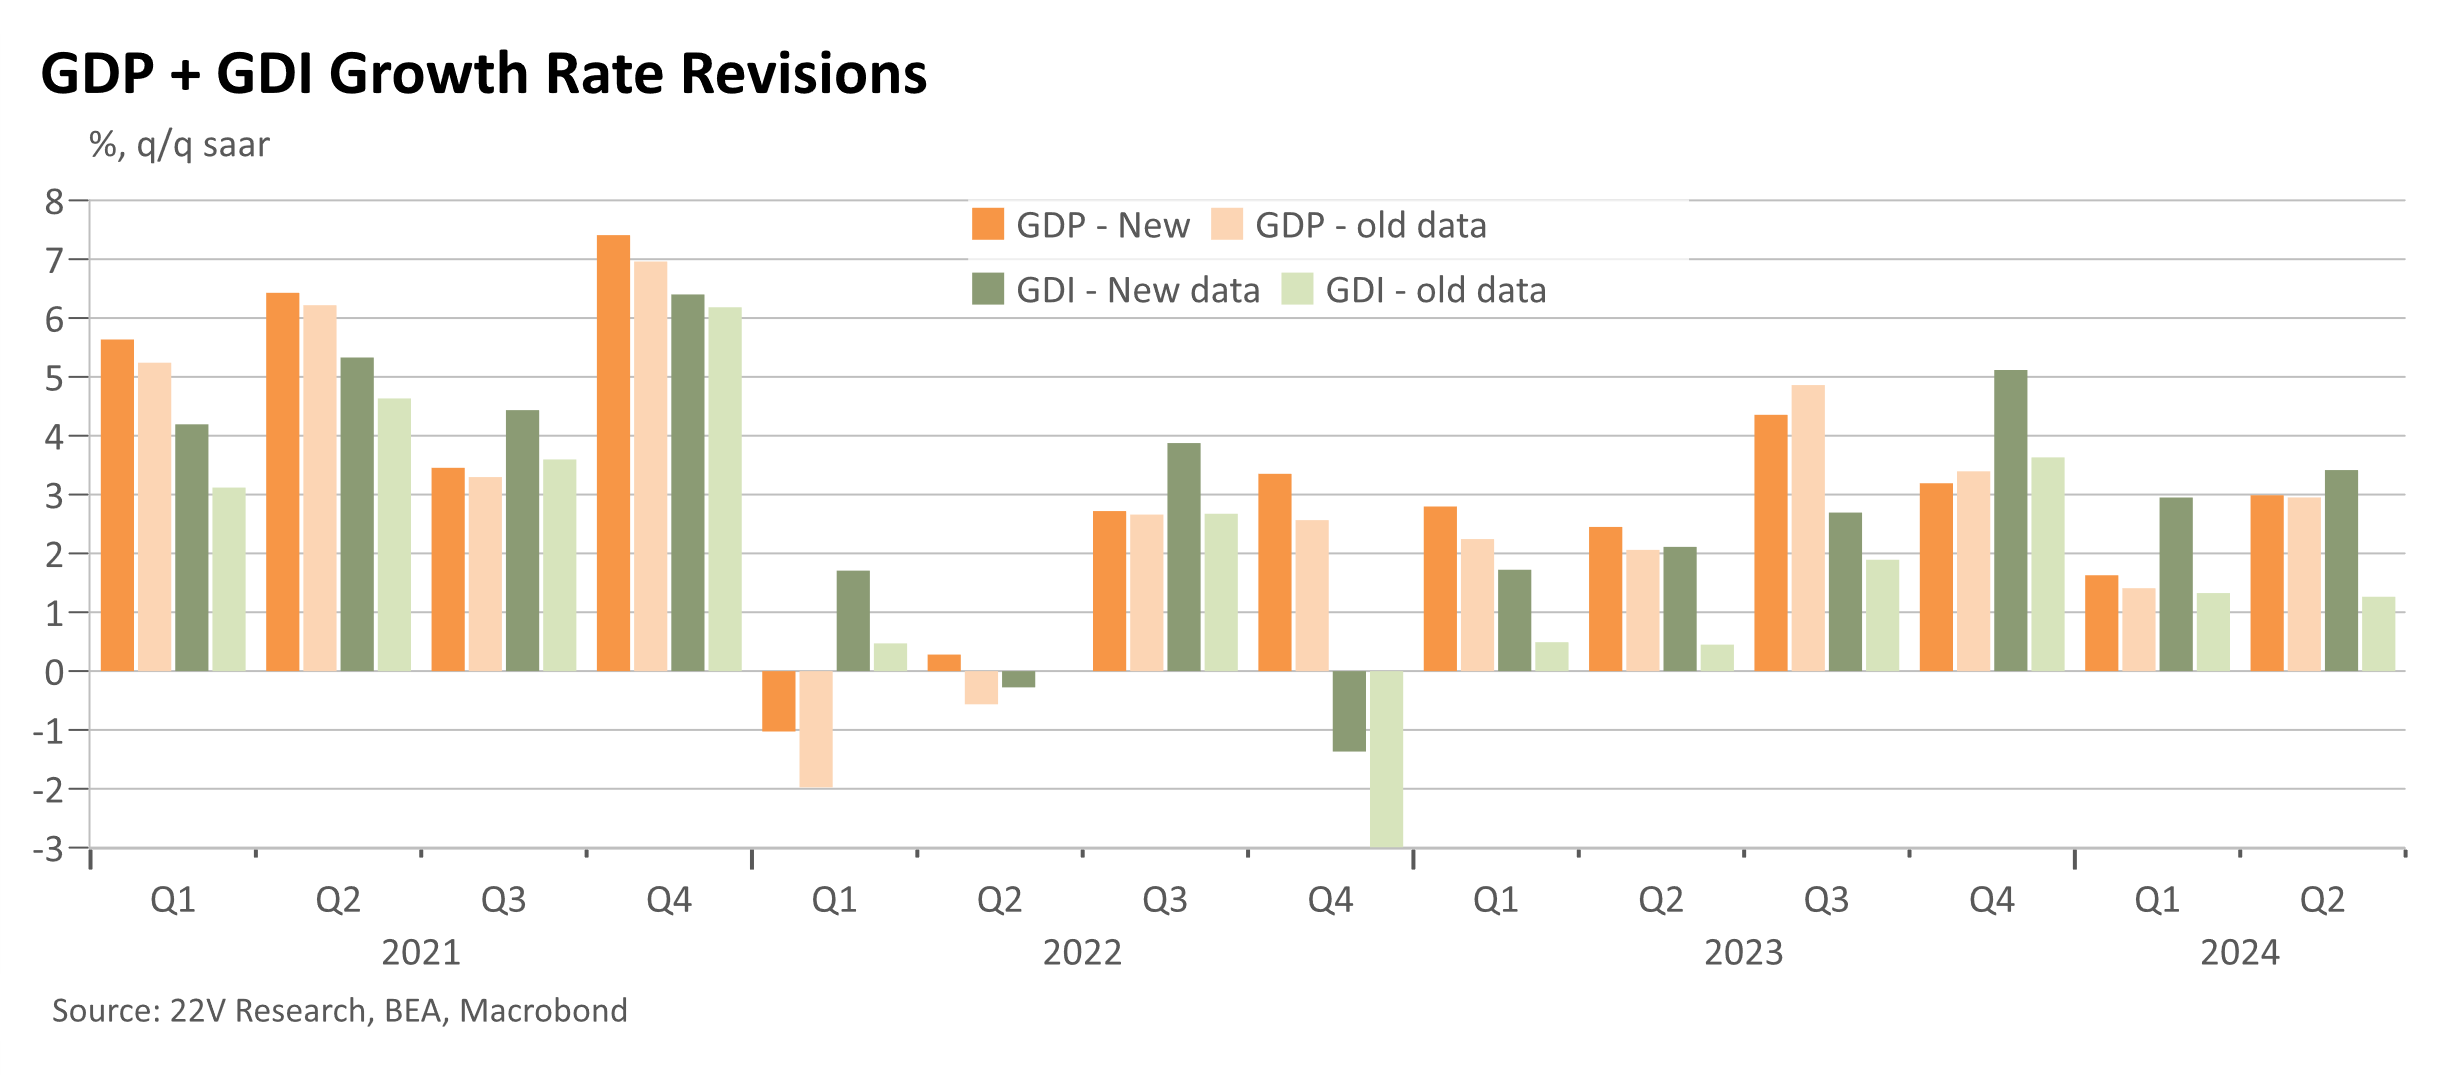
- Given that GDI has somewhat greater procyclicality than GDP, its recent weakness had been a reasonable cause for concern (although there were reasons to doubt the data in real-time). This has been fully eliminated by these revisions as GDI growth was revised up an average of 1.7p.p. for the past 3 qtrs. The story of recent past is significantly and more optimistically different.
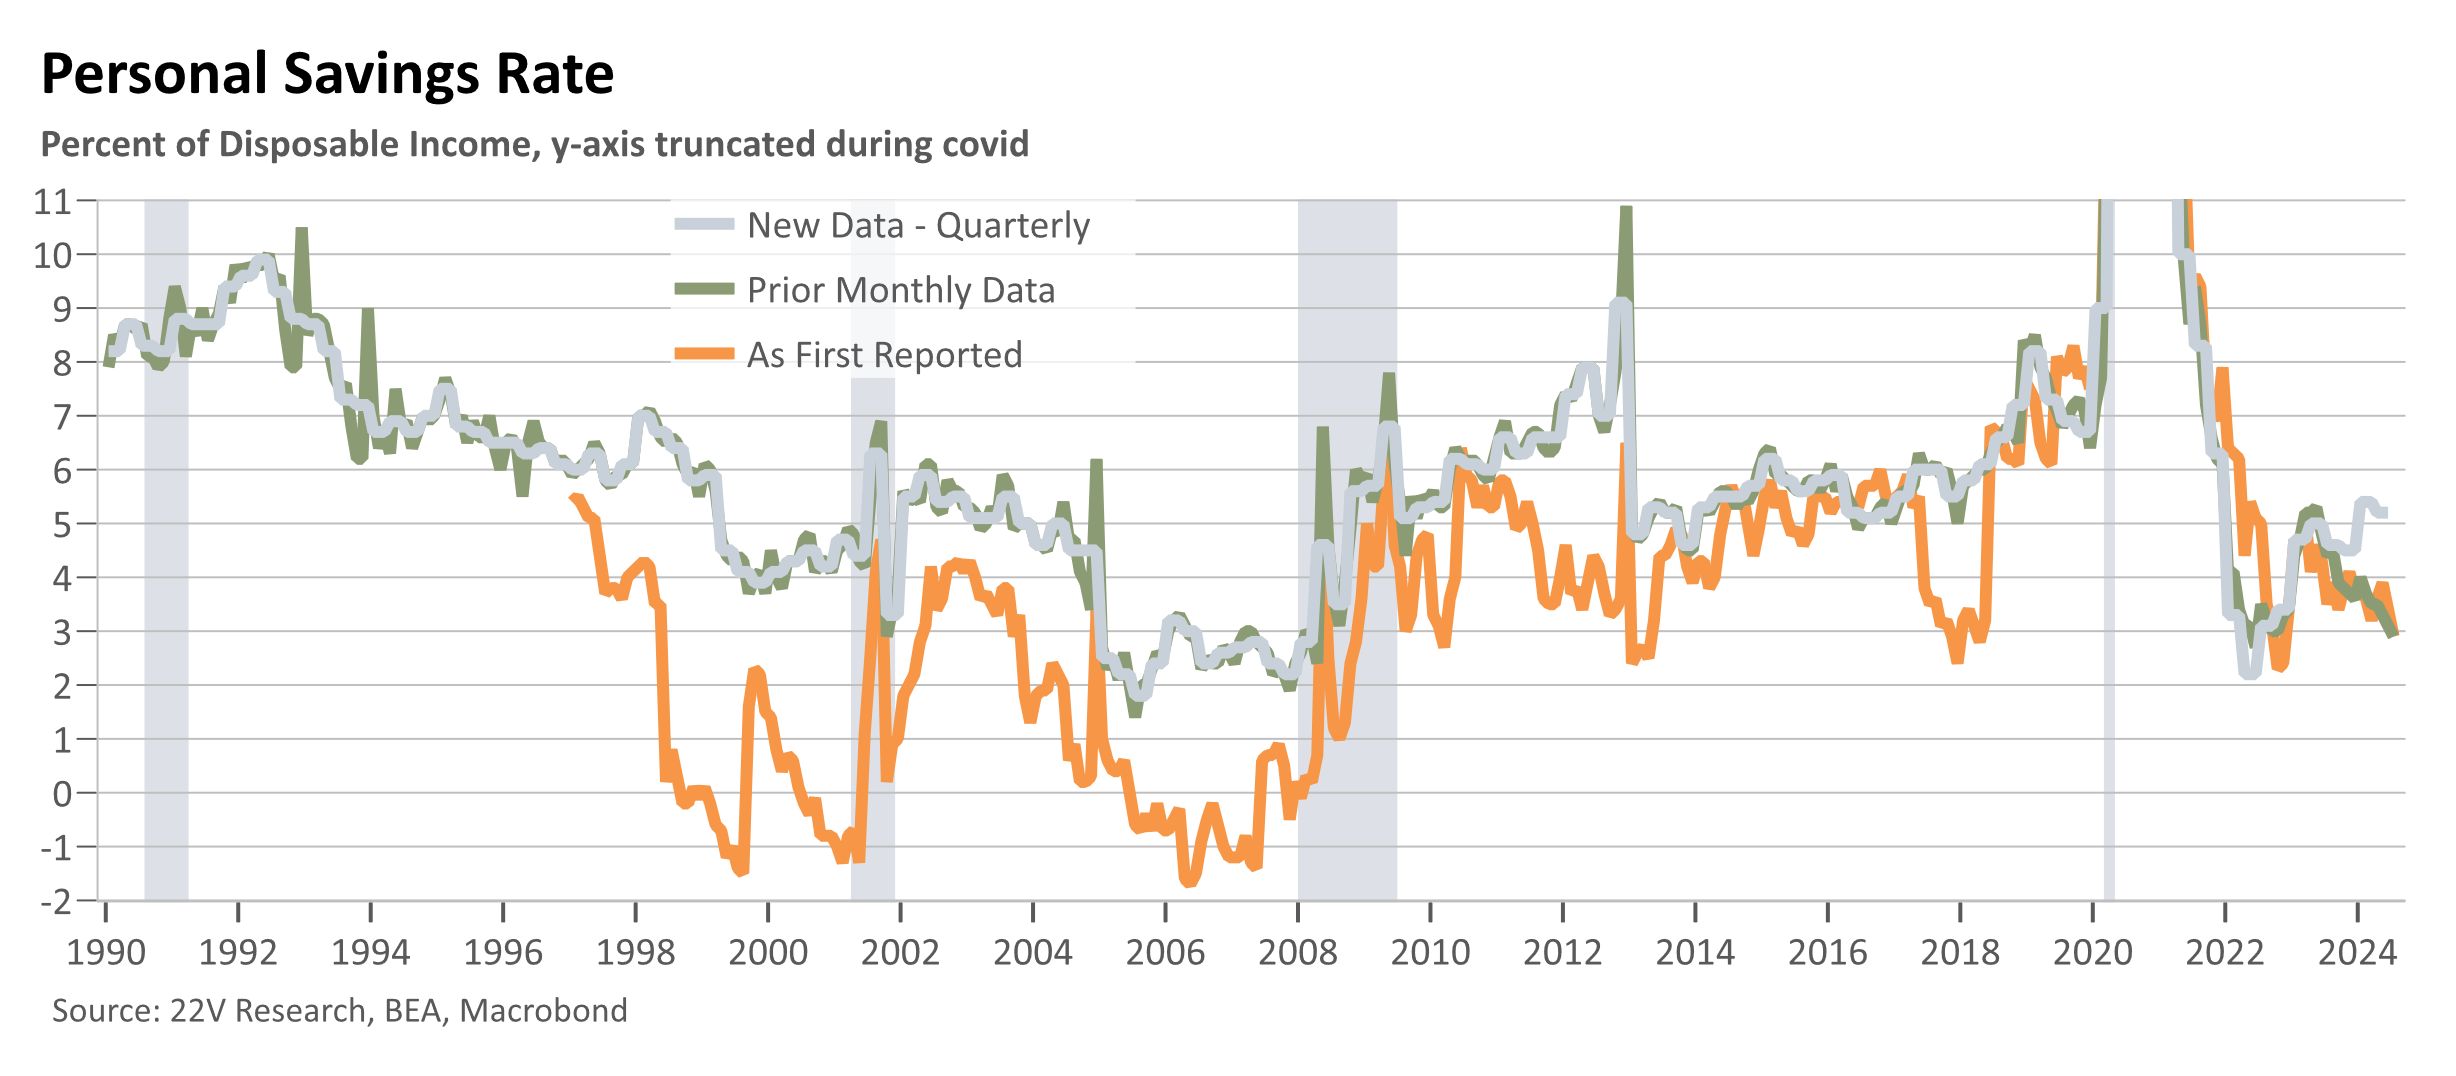
- The level of the savings rate is now around 5%. Q2 saw the savings rate revised up from 3.3% to 5.2%, Q1 from 3.7% to 5.4%. This had been another area of concern (future consumer retrenchment as spending power wound down) which would now be hard for anyone to point to with alarm.
- Over 2018-23, a period with perhaps starkest downside surprise ever to US economic activity, average GDP growth was revised 0.2p.p higher to 2.3% and average GDI growth 0.4p.p. higher to 2.2%. The Fed’s view of potential GDP growth, at 1.8%, seems too low and anchored to the immediate post-GFC experience.
- The recession that never was in 2022H1, when we had two consecutive quarters of negative GDP growth, is now no more with Q2 revised into positive territory.
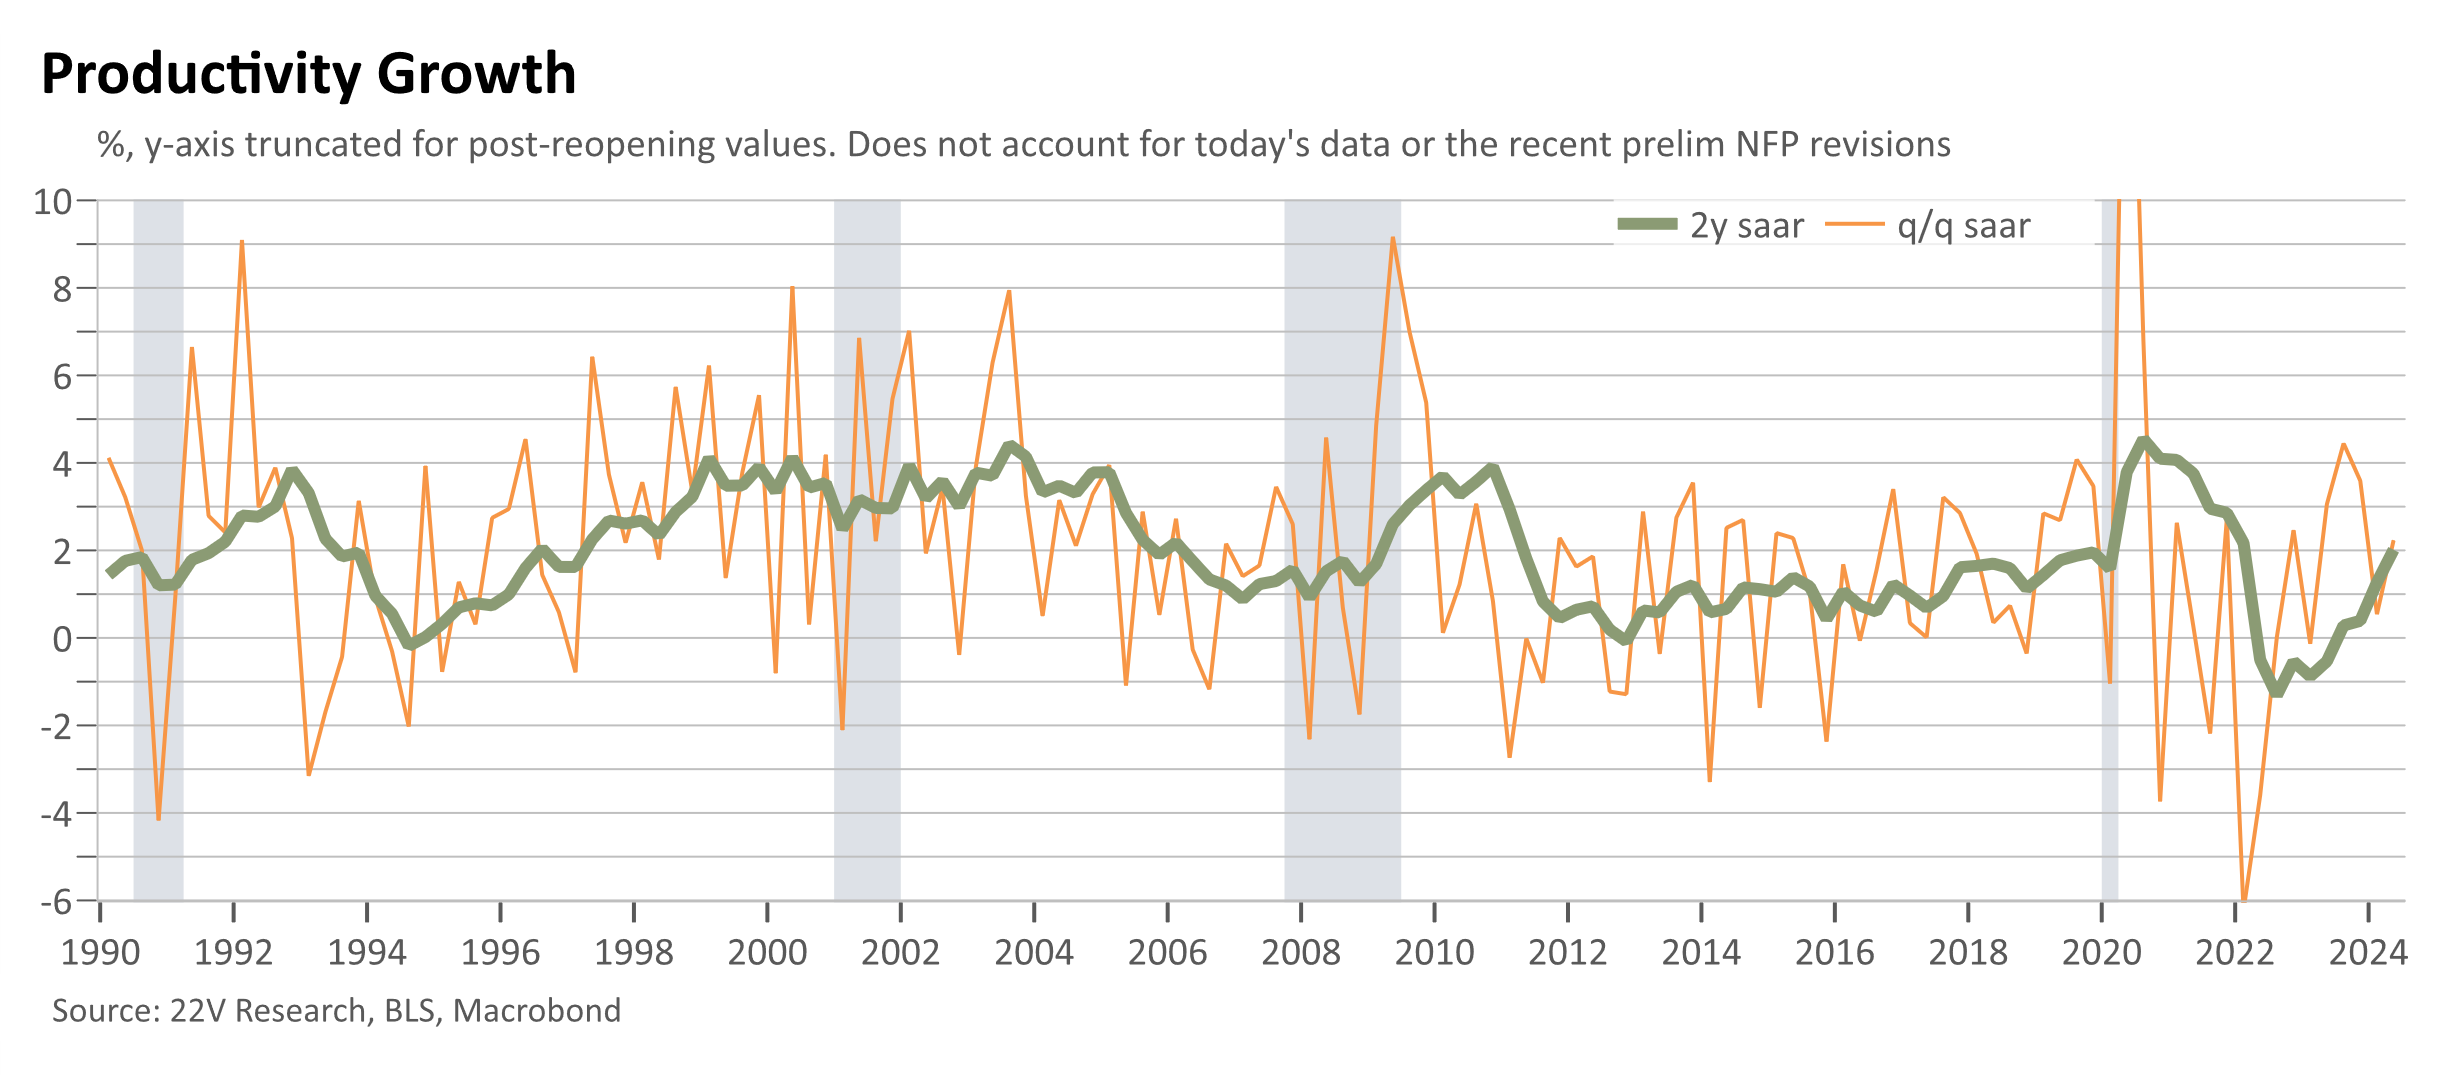
- Taken together with reasonable guesses for the likely benchmark NFP revisions (to the downside), the boost in productivity growth over the past few years has been even stronger than thought. After such large negative supply shocks and labor allocation challenges, the economy has seen remarkable supply side performance over the past 2 years.
- I continue to think that forecasting based off residuals (the savings rate and productivity growth most prominently) is a very fraught endeavor and arguments based off them, in either direction, should be treated with substantial skepticism.
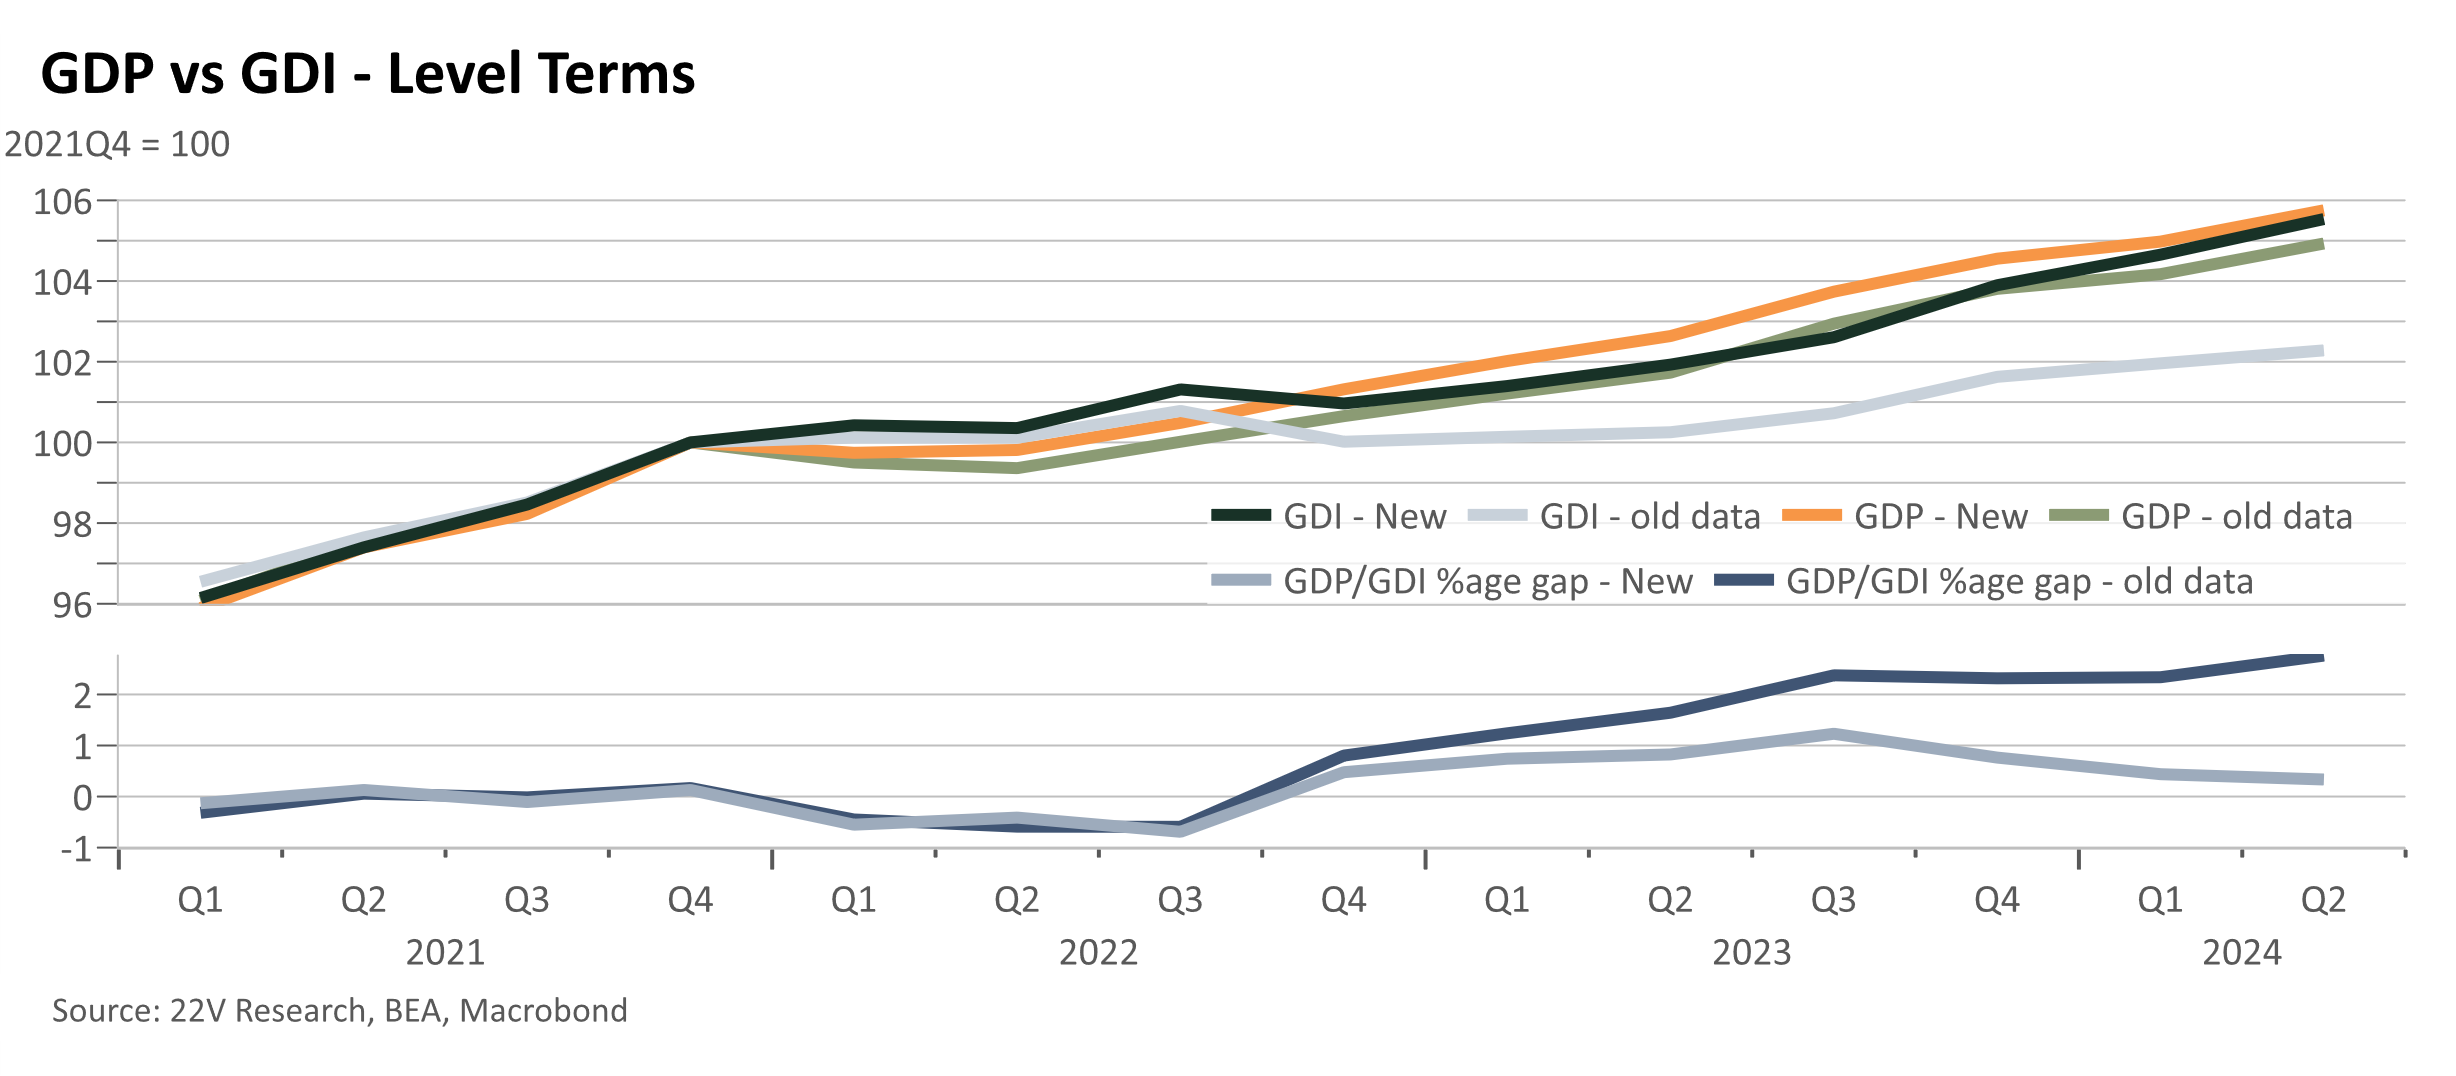
Over the past few years, gross domestic product (GDP) growth has been notably stronger than gross domestic income (GDI) growth. In theory the two measures should be the same but they can depart due to differences in source data, noise, and some different degrees of cyclicality in the data. GDI tends to be a bit leading and more cyclical than GDP (see more here from the Obama-era council of economic advisers on this).
This reasonably led to cause for concern that the gap between the two might be closed to the downside and that GDI growth was more telling of underlying cyclical conditions than was GDP. GDI growth had seemed a bit more consistent with the more sluggish NFP trends seen over the past 18m than was GDP.
Instead, the revisions today saw the real level of GDP revised 1.3% higher and GDI up 3.7%.
In many macroeconomic models, especially those focused on modeling the supply side of the economy and extracting estimates of the proverbial long-run stars, there is substantial weight placed on GDI (as well as GDP and a host of labor market data, see my old work at the IMF here and the Fed’s FRB/US supply-side model here). These upside revisions will mechanically boost many model-based estimates of recent supply-side developments and productivity growth. Of course, tacking estimates cueing off of GDO (the average of GDI and GDP) will look notably more optimistic as well.
This more of less fully closed the gap between the two series and substantially alters our understanding of the past in a universally positive way. A few quick specifics:
- The recession that never was in 2022H1, when we had two consecutive quarters of negative GDP growth, is now no more.
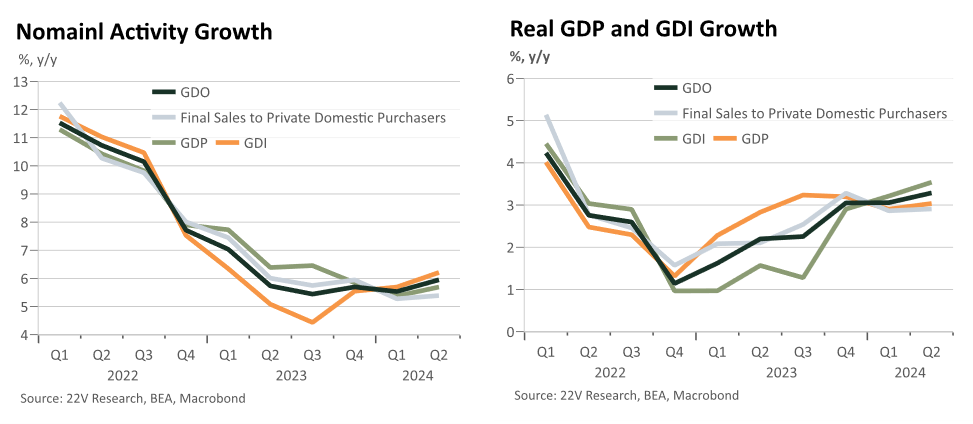
- Across activity measures (GDP, GDI, final sales to private domestic purchasers) real y/y growth troughed in the low-to-mid 1s in 22Q4 and has since rebounded to 3% or a bit above.
- In a period with perhaps starkest downside surprise ever to US economic activity, average GDP growth from 2018-23 was revised 0.2p.p higher to 2.3% and average GDI growth 0.4p.p. higher to 2.2%.
- The GDI revision was not just all in the mysterious ether of the national accounts either, as the Q2 level of wages and salaries was revised up by $148bn while “core” personal income (compensation of employees + proprietors’ income) was revised up $307bn.
- The net impact of the income and spending revisions is a substantial shift higher in the savings rate over the recent past, taking its current level to the low-5s from the low-3s in Q2 with little recent sign of deterioration.
- The positive revisions in the national accounts data (when thinking in level terms, a few quarters here and there saw small downward growth rate revisions) lean against the recent trend in the labor market data. This is a bit puzzling given the usual pro-cyclicality of revisions to economic data, but again is in keeping with the discrepancies between the labor market and activity over the past few years.
Don’t Weigh the Savings Rate Heavily, But it’s Not a Cause for Concern
The recent decline in the savings rate had given many cause for concern. They suggested that this decline meant that the consumer was about the run out of spending room and notably retrench their spending habits. More tentatively then, this could have spiraled into a firm-expectations falsification and layoff problem. I was skeptical of this because the savings rate itself is very revision prone in real-time making it a troublesome out-of-sample forecasting tool and because wealth effects were substantially supportive of consumer activity even if the savings rate had dipped (see more here).
It turns out that the savings rate has been grinding higher since early-2022 and while still below pre-covid levels its hard to take seriously the notion that savings rates’ recent behavior could be a harbinger of spiraling future weakness.
The best causal source of a possible recession remains where it has always been, in the labor market. If the emergence of labor market slack, can become self perpetuating and dominate the sluggish but positive growth in employment seen in recent quarters than we’ll almost surely have a recession.
A Remarkable Period for the Supply Side
Lurking under the hood the data is an even stronger supply side story than we had previously thought. After the myriad of disruptions to the supply side and labor market functioning from 2020 to early-22 the recovery in the supply-side of the economy has been remarkable as it a testament to the power of positive cyclical support to the economy (during 2020-21, as well as the Fed’s preventing SVB from spiraling).
The data today, when combined with reasonable guesses based off of the quarterly census of employment and wages and the preliminary benchmark NFP revisions, suggests that productivity growth has been even higher than already seen taking it to a fairly sustained pace above its pre-covid level. After revisions, aggregate hours worked are likely to be have been growing, tentatively, around 0.5% over the past year (gradual workweek normalization with just a bit around 1% headcount growth according to the QCEW). Given real output growth of just a bit above 3% y/y this suggests an eventual upwards revision to productivity growth from its already healthy pace.
Another way of seeing this is that as inflation and legacy supply and labor disruptions have faded out of the data, the composition of nominal activity has been improving. This seems to be taking place even as y/y nominal GDO stopped decelerating in 23Q3 and has been running at 5.5-6% since then. Eventually, if disinflation stops (there is only so much normalization of supply disruptions that can take place) this pace could be an issue and its part of why I wonder about inflation in 2025-26 but that’s a problem for a different quarter.