July PCE Data: One Has to Try Hard to See Much That Looks Bad
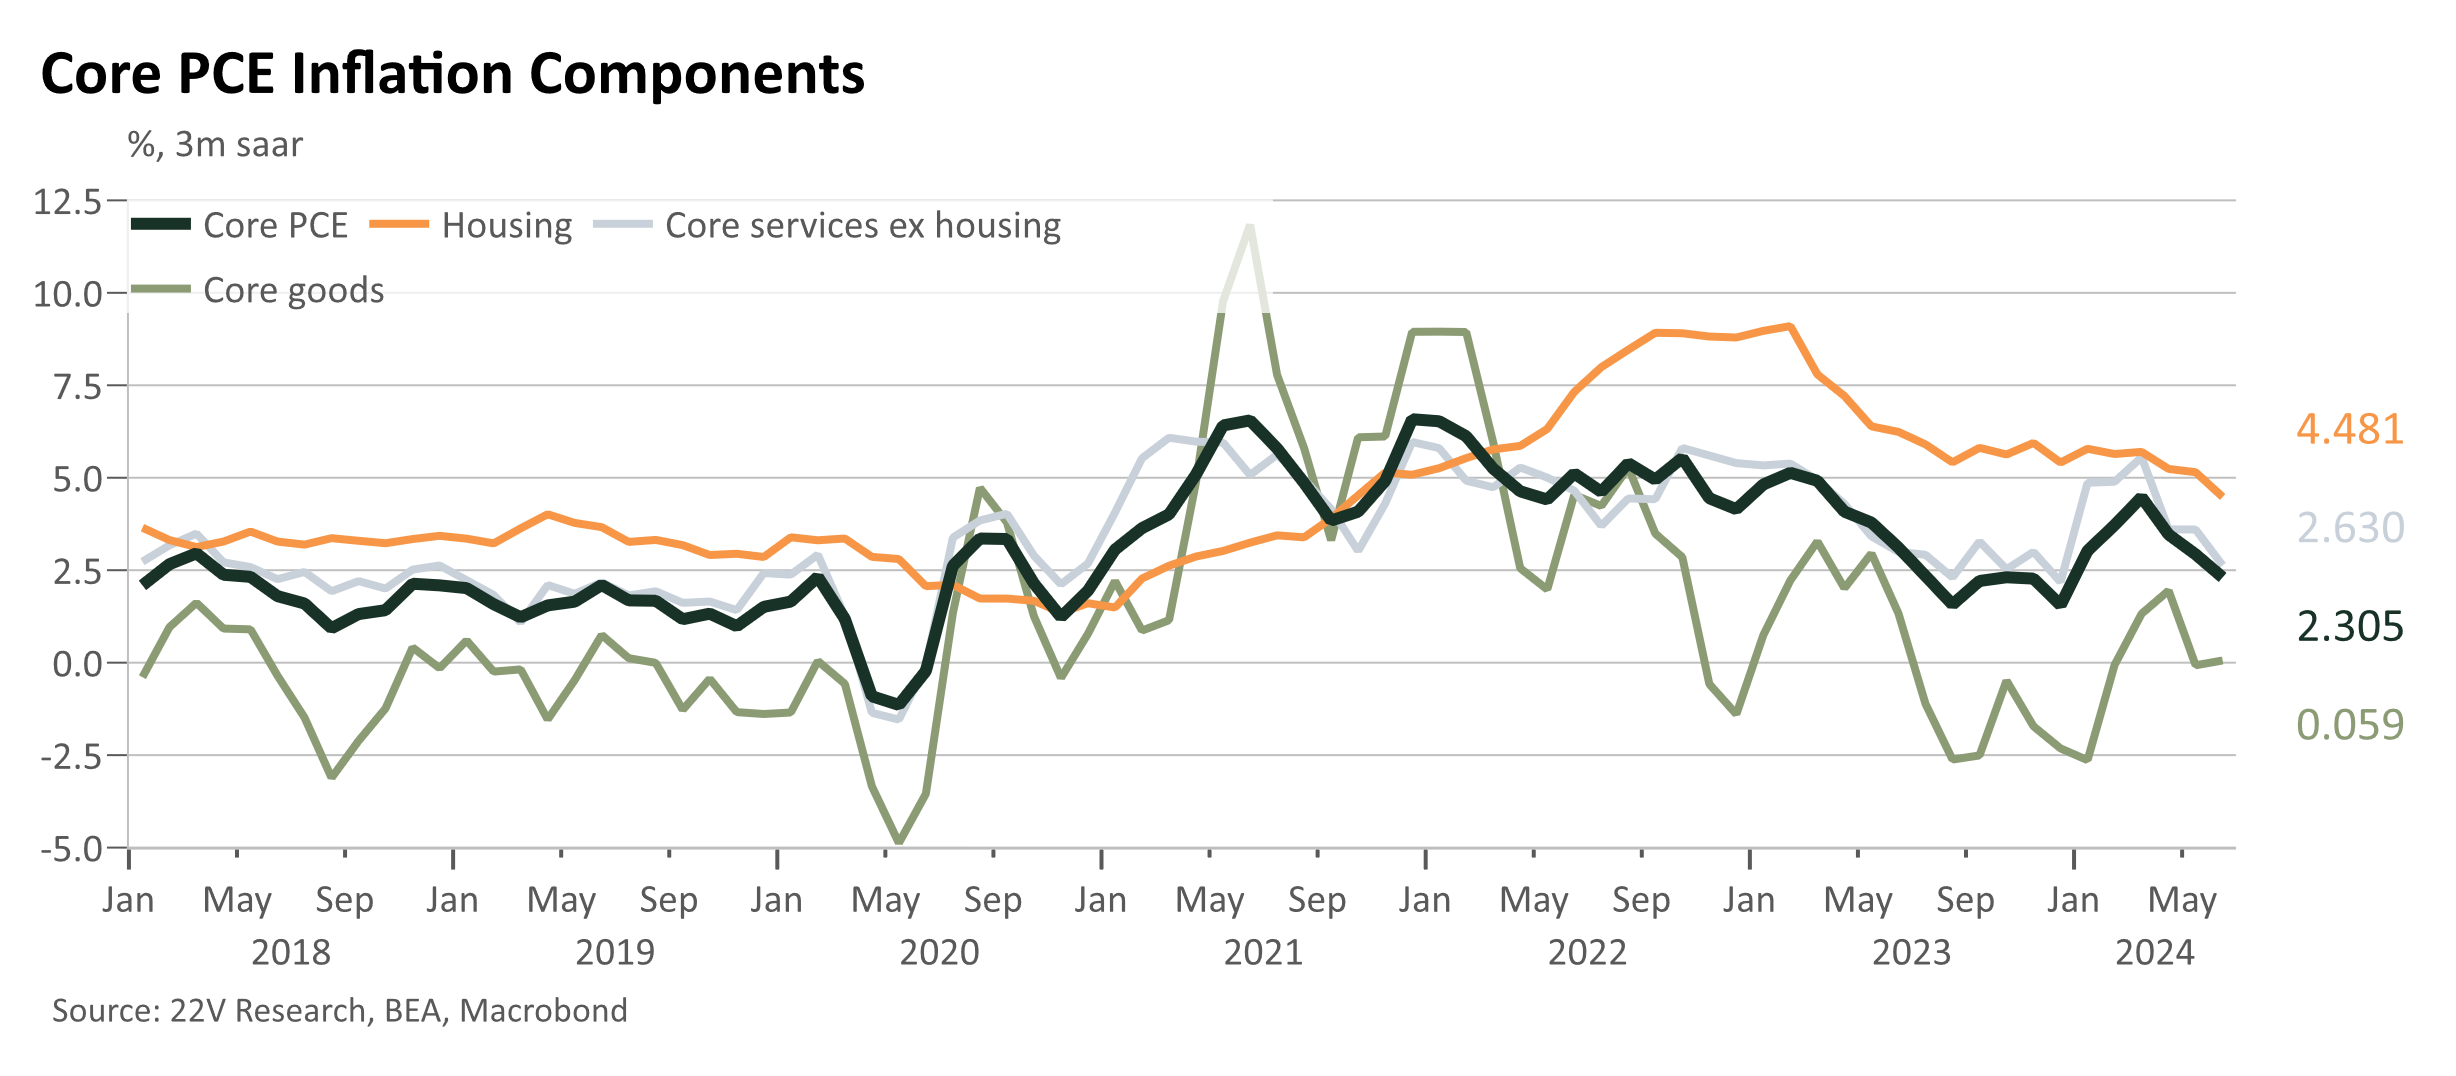
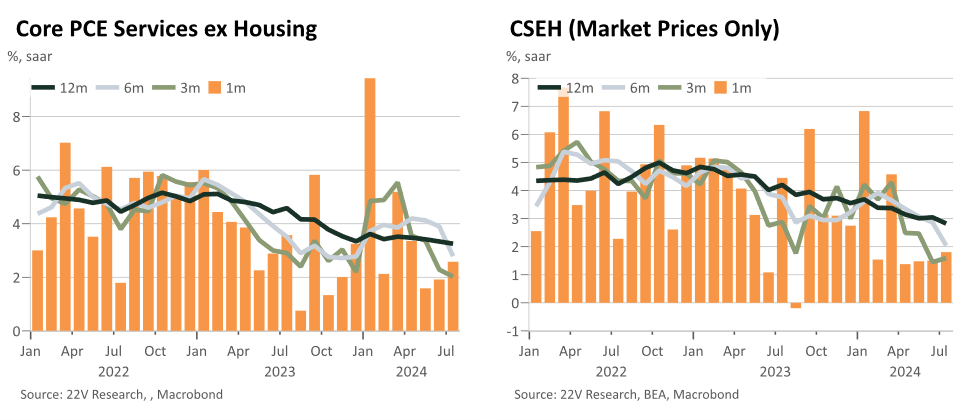
- The July core PCE data came in right in line with target and is the third month in a row of unambiguously good data. Inflation’s internals also look largely benign over the past 3-4 months with core services ex housing and market prices only data both looking good enough to change the near-term risk management calculus for the Fed.
- Given the data since June and a reasonable base case for the rest of the year, the Fed’s 2.8% core PCE forecast for 2024 in July is likely to be revised down in September.
- Over the medium-term one shouldn’t be 100% convinced inflation is completely anchored to target but it seems unlikely to present a problem to the Fed’s initial 2024 rate cut plans given the downside risks to the labor market they are now, appropriately, focused on.
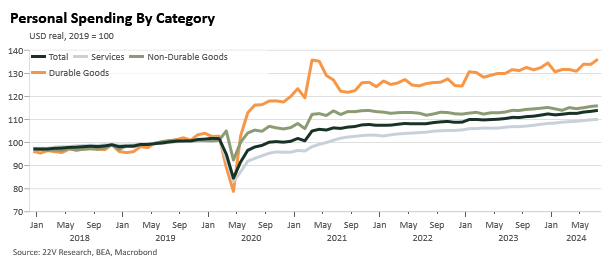
- Personal spending was quite strong, driven by some payback in autos after the June dealership hack. Durable goods spending *might* (very tentative observation) be starting to bounce a bit again after moving sideways since mid-23; this includes both the topline and ex-autos.
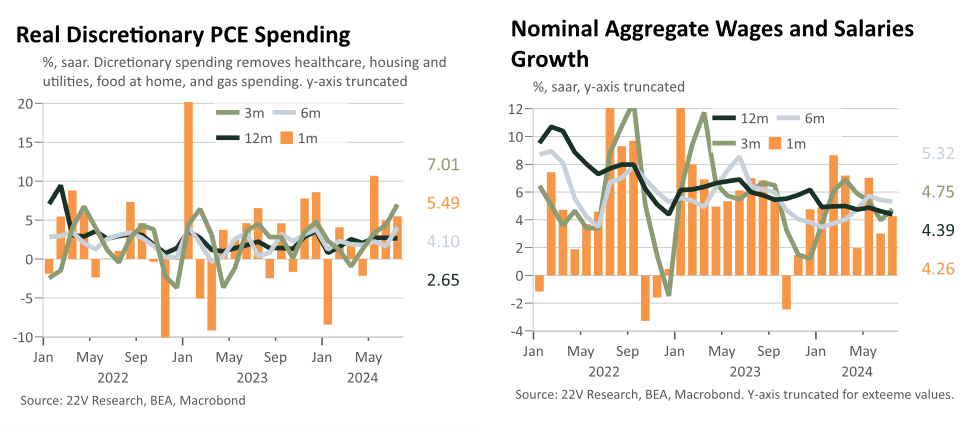
- Aggregate wages and salaries growth, my preferred way of looking at the income data, are running in the mid-4s; solid but largely in line with pre-covid trends. This suggests somewhat slower spending growth over the medium-term but very overall strong household balance sheets and a possible refi wave lean the other way.
- The savings rate moved down again but the implications of this are more mixed than the immediate headline bearishness might assume; more on this below.
Over the past year, nominal aggregate personal spending growth is running just above 5% while nominal aggregate wages and salaries growth is running in the mid-4s, with a lot of volatility. This suggests that spending trends should gradually slow some over the medium-term but the near-all-time-highs in consumer net worth and looming possible refi wave lean the other way.
Realistically, as earnings season was fairly clear on too, some parts of the lower-and-middle income consumer seem more stressed, especially those who gained access to otherwise unavailable credit early on during the pandemic (see more here), but overall spending trends point towards normalization and heightened dispersion rather than outright weakness or current deterioration.
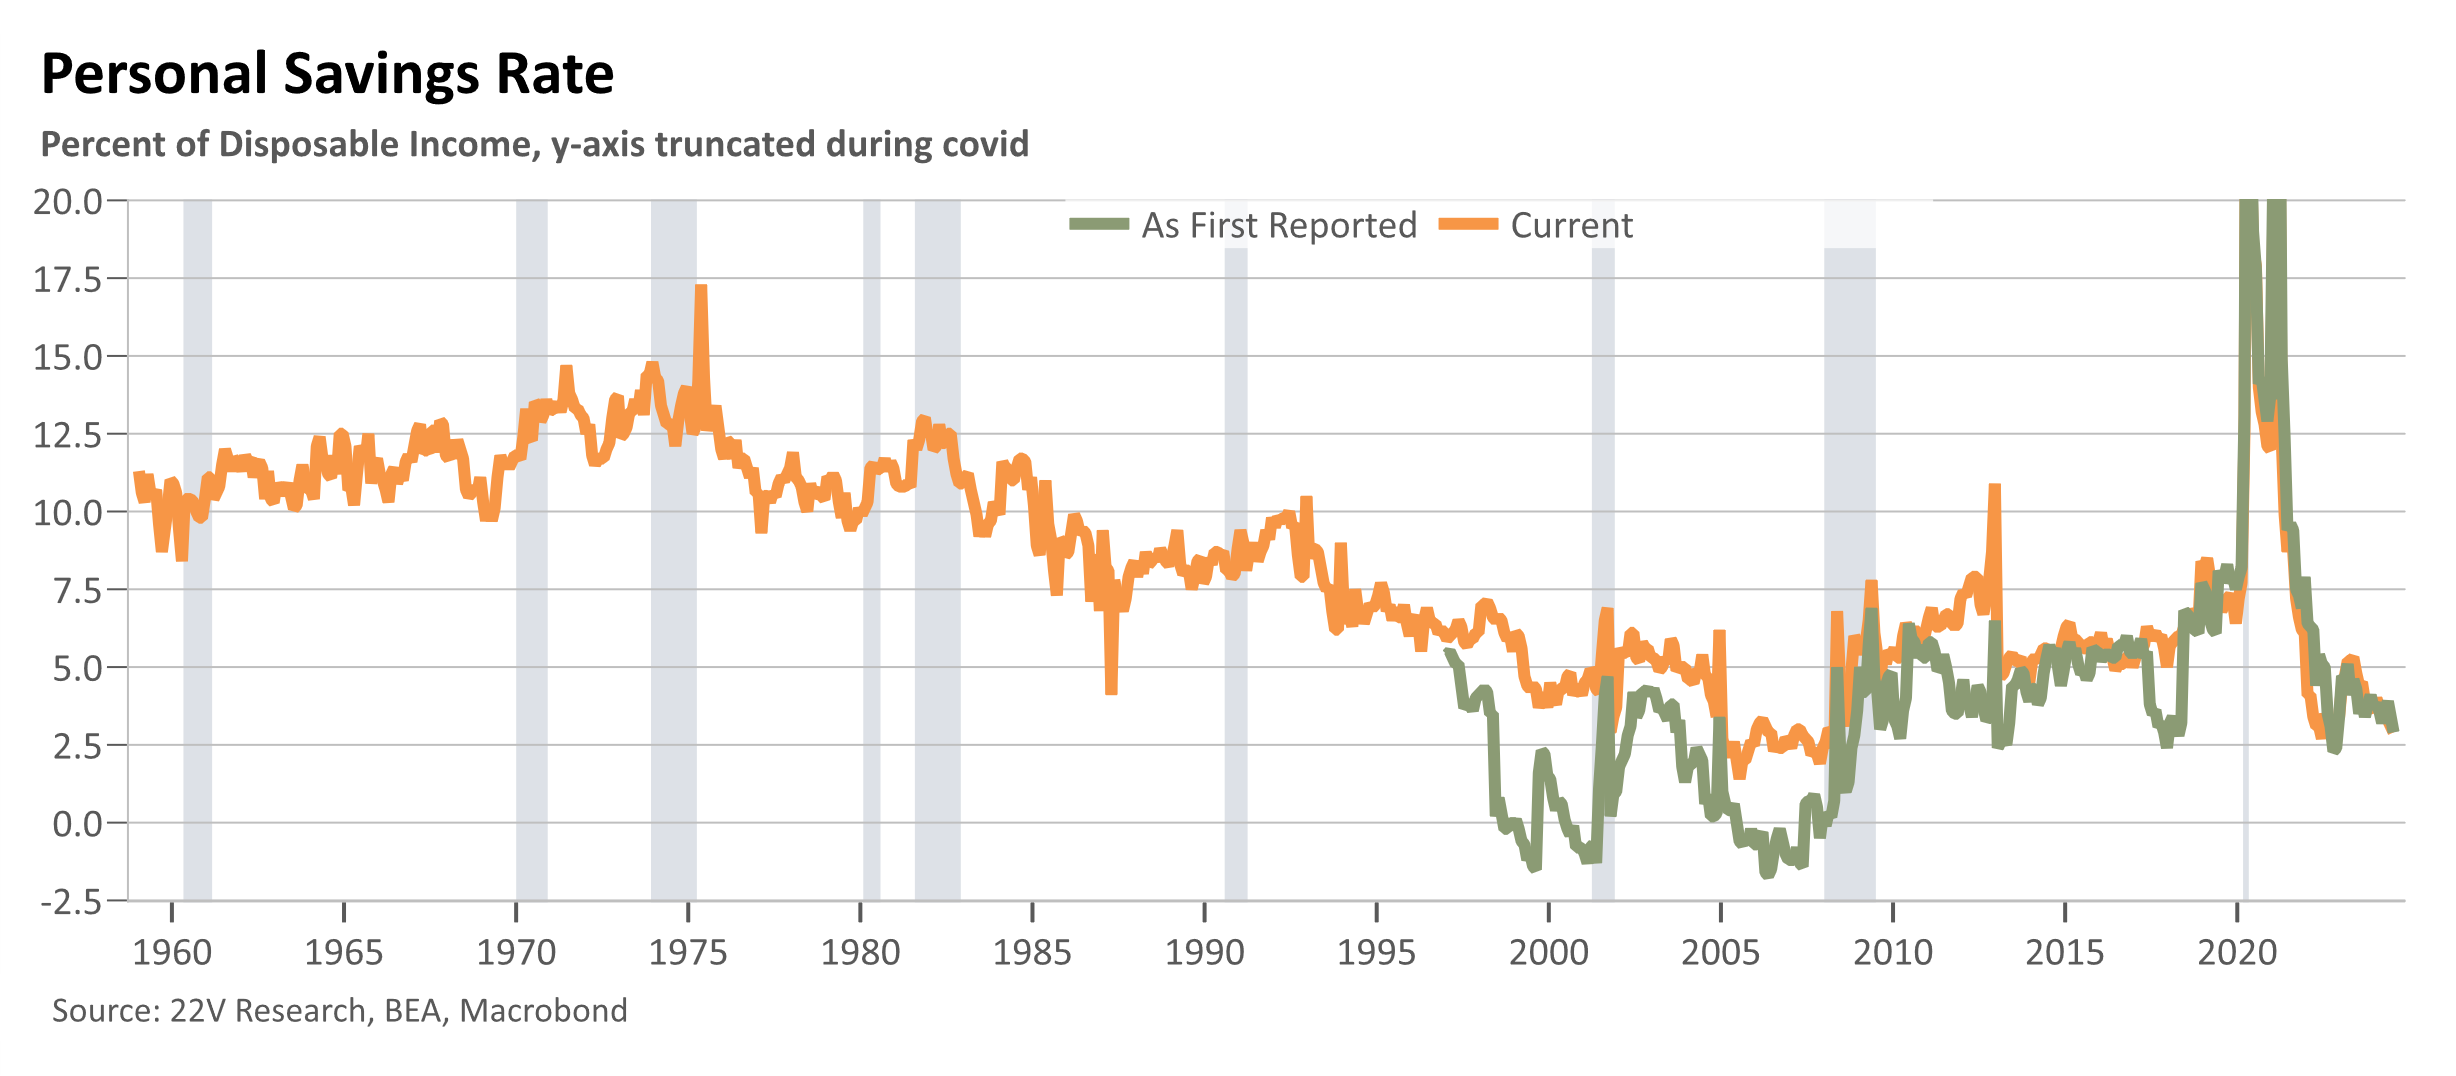
The savings rate presents one of the more interesting pieces of the data in the release but also one which seems hardest to use in real-time. After a bounce in early-23, it has fallen almost back to the cycle lows again (the timing of this bounce may have other accounting drivers, but does line up with when layoff announcements peaked and SVB and other FCI tightening shocks occurred). There are two alternate framings here. The first is that the absence of a sharp jump higher in the savings rate is confirmation that the economy is not currently falling apart with consumers willing to spend; the precautionary savings motive dominates during, and helps accentuate, recessions. The strength of household balance sheets, which has seen net worth steadily increasing relative to income since the early-80s, also suggests that the savings rate could plausibly be even lower based off of historical relationships. The second perspective is that consumers are stretched and the drawdown in the reserves of possible spending power means that as or if labor demand slows further, spending will rapidly correct to the downside. Admittedly, these aren’t necessarily incompatible as they operate on somewhat different timelines. The caution on this second point is that with the current cyclical position of the labor market, increasing slack (low layoffs, and private sector net hiring which has been bouncily slow but broadly positive for 16 months now) it is unclear which of these labor market forces, that are normally much more correlated than they currently are, is the most appropriate one for triggering this deterioration.
Of course, given where we are in the mid-to-late cycle environment, risks are skewed to the downside until the labor market slack measures starts steadying themselves and we see more conclusively positive, or no longer decelerating, momentum for labor demand.
More broadly, as a residual, (disposable income – spending) the saving rate is especially revision prone and is something I am quite cautious about placing too much forward-looking emphasis on as a result. Historically, the directional moves of the savings rate tend to be preserved by future revisions, but the levels are often wildly different and the revisions have tended to move the savings rate higher not lower (not to say that should be a base case here, but rather reasoning from such a revision prone series seems potentially problematic and can usually best be done by thinking about the causal story of labor market weakness and spending capitulation risks rather than leaning on the savings rate directly). With gross domestic income currently running ~2.5% below GDP the risk of impactful revisions, on either side of the ledger seems notable, especially with corporate profits and net interest related issues (which are the most poorly measured parts of GDI) looking particularly soft.
The annual benchmark revisions to the national accounts data, including GDP, GDI, and the PCE inflation data, will be released on September 26th along with the 3rd estimate of the Q2 GDP data. This will cover 2019-24Q1 data and may help shed some light on the GDP-GDI discrepancy and the behavior of the personal savings rate over the past few years.