SUMMARY: Waller sounded more hawkish than he has been, and UST yields up some. Peter Williams noted in a report after Waller’s speech (HERE) that “the Fed likely needs to see 2 more 0.2s on core PCE to feel confident enough to cut in June”. Powell has a desire to cut, so June cut odds should remain above 50% and 0.3% or above would likely take June off the table. That should be the focus. April 10th CPI will be important. Also, the Fed is likely reluctant to be too dismissive about the recent increase in the unemployment rate (HERE), so we shouldn’t expect significant changes to the Fed’s outlook UNLESS the inflation data gives them a reason to change that outlook. Unless 0.3% or above core PCE readings happen, expect yields to grind sideways to lower and financial conditions to remain stable. Don’t chase the yield move today.
The S&P is basically flat since the Fed meeting, but Deep Cyclicals, Earnings Risk and Value have significantly outperformed. From a more thematic point of view, MS22RISK (MS22RISK Index go on Bloomberg), which is a long risk-on and short risk-off, is up +2.4% since the Tuesday before the FOMC. Unprofitable small caps (MS22USML Index) and companies with debt sustainability problems (MS22DEBT Index) – two indices most levered to the economic cycle – both rebounded.
The market seems to be anticipating stable financial conditions. That likely means investors are NOT ANTICIPATING HAWKISH inflation. That doesn’t mean they are anticipating dovish inflation. Inflation data just needs to be good enough (heading toward the 2.6%ish core PCE the fed is forecasting for 2024. 2.7%/2.8% wouldn’t change the world) to keep financial conditions stable and for risk factors to move higher. We don’t think investors have internalized the good enough point.
Small/Mid Cap Correlations and Vol: The 1-month rolling correlation between small and mid-caps has dropped significantly. Industry group selection and micro themes are much more important as small cap correlations decline. Energy, Materials, and Tech small caps are +6% MoM. Telecom (-3.6% MoM) and Healthcare (-5% MoM) have been MAJOR drags. Dispersion is increasing and this dispersion is missed when focusing on IWM returns (+2.8% MoM). Buying profitable small caps and shorting unprofitable names (MS22LPSU Index on bbg) has gained 4.5%.

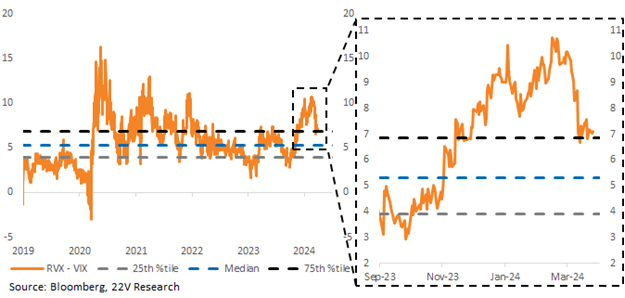
Also, small cap vol is still in its the 75th %tile relative to large cap vol. Small cap vol has plenty of downside. Typically, that is a positive for small cap returns. Lower correlations are tied to lower small cap vol.
Full report below…
MARKET VIEWS: UST yields are higher this morning following Fed Governor Waller’s more hawkish (vs. his previous stance) comments last night. Specifically, he is “going to need to see at least a couple months of better inflation data before I have enough confidence that beginning to cut rates will keep the economy on a path to 2 percent inflation,”. As Peter Williams noted (HERE) following the Waller speech, the Fed likely needs to see 2 more 0.2s on core PCE to feel confident enough to cut in June. Powell has a desire to cut, so June cut odds should remain above 50% and 0.3% or above would likely take June off the table. Also, the Fed is likely reluctant to be too dismissive about the recent increase in the unemployment rate (HERE). Bottom line, unless the 0.3% or above core PCE readings happen, expect Yields to grind sideways to lower and financial conditions are unlikely to change much.
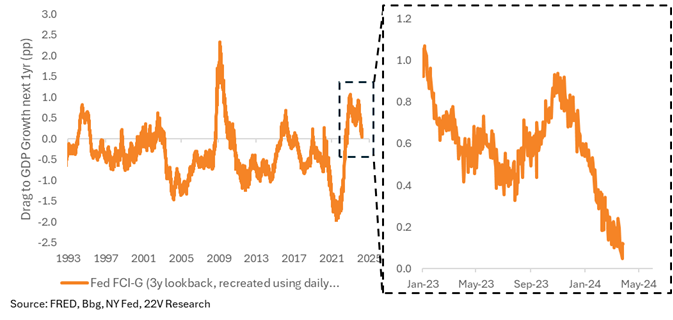
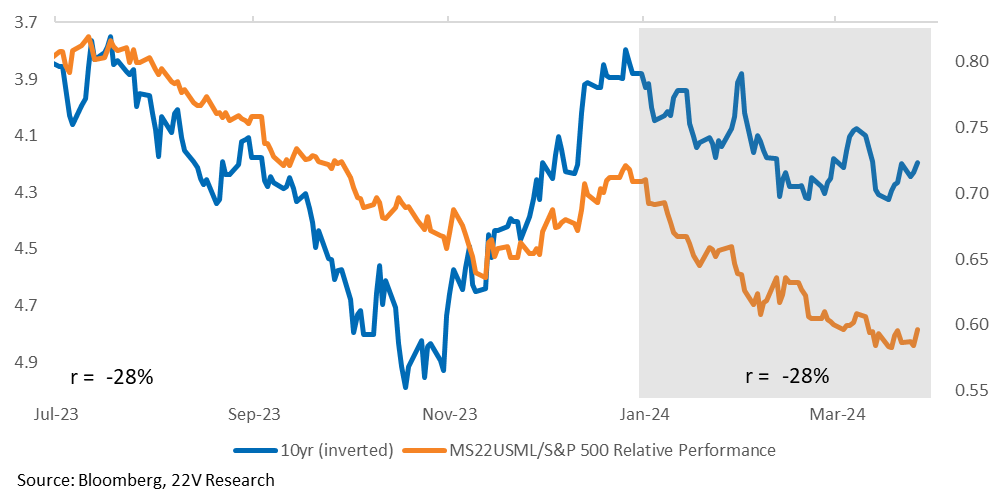
If financial conditions are unlikely to change much (CPI data on April 10th is a swing factor), risk-on factors should continue to work. The S&P has been basically flat since the Fed meeting, but Deep Cyclicals, the Earnings Risk and Value have significantly outperformed. From a more thematic point of view, MS22RISK (MS22RISK Index go on Bloomberg), which is a long risk-on vs short risk-off (net zero), is up +2.4% since the Tuesday before the FOMC. Unprofitable small caps (MS22USML Index) and companies with debt sustainability problems (MS22DEBT Index) – two of the indices most levered to the economic cycle – have both rebounded.
Volatility & Correlations: There was an extreme spread between large and small cap volatility earlier this year. Since mid-Feb, small cap vol has come off the boil, but there is still an unusual wide-spread (75th %tile) between large and small cap volatility. If the Fed is going to cut (it doesn’t really matter how many times), financial conditions are unlikely to change much from here and small cap vol will continue to move lower relative to large cap vol. There is still more room to go.
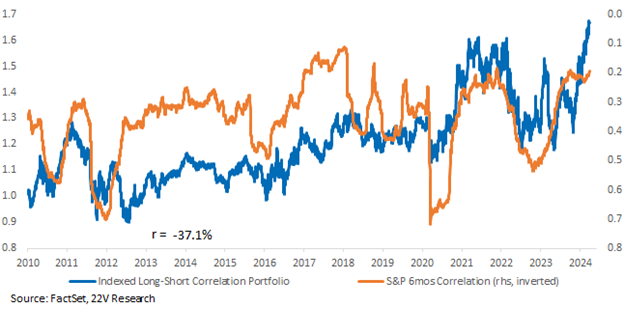
The 6-month rolling correlation between small caps is still elevated, but the short-term correlation has dropped significantly. Industry group selection and micro themes are much more important as small cap correlations decline. Energy, Materials, and Tech small caps are +6% MoM. Telecom (-3.6% MoM), and Healthcare (-5% MoM) have been MAJOR drags. Dispersion is increasing and this dispersion is missed when just looking at IWM returns (+2.8% MoM). Also, a simple strategy of buying profitable small caps and shorting unprofitable names (MS22LPSU Index on bbg) has gained 4.5%.
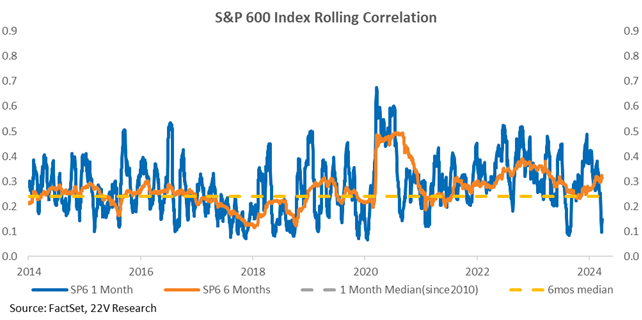
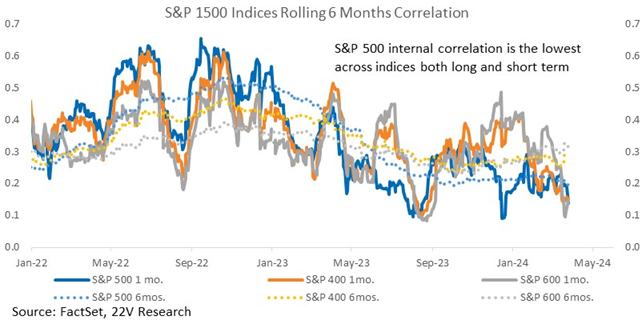
Across different market caps, the S&P now has the lowest correlation on a 1 month and 6 months basis. In other words, stock picking is the most effective in large caps, but Small and Mid-cap correlations are likely to continue “catching down” unless the inflation backdrop gets much worse. Making stock picking more effective in both categories.
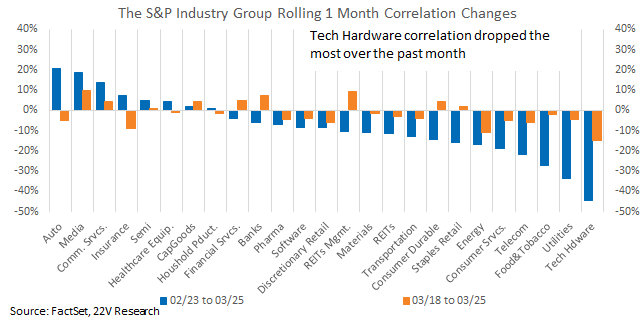
Within S&P industry groups, more than two thirds have seen lower correlations over the past month and week. Tech Hardware correlations dropped the most and are now exceptionally low. Auto, Media, and Communication Services correlations have increased but remain at normal levels. The bottom line is stock picking and factor analysis remains much more valuable than it has been over the past few years.
A portfolio we monitor that is designed to benefit from lower correlations has done very well. Happy to send the list.