Back Quantitative

Quant Market in Numbers: Divergent Risk Preferences Within Market Caps

Published on March 20, 2024

∙ Download the PDF Report

By

Dennis DeBusschere

Brian Herlihy

Sophia Wang

Kevin Brocks

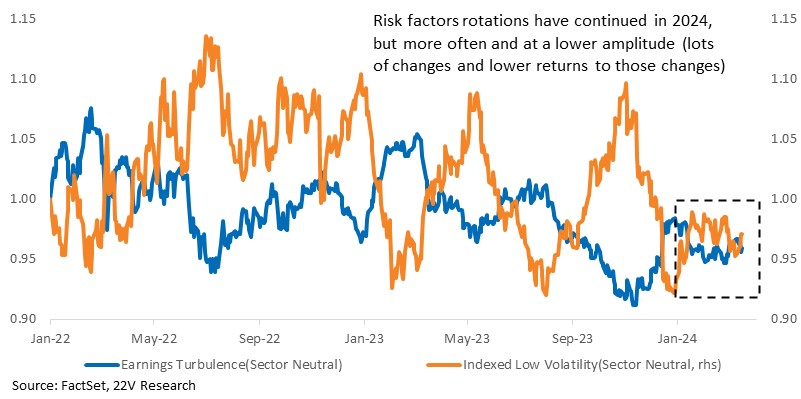
Equity markets, particularly at the industry group level, have been mean-reverting this year (HERE). At the factor level, risk factors have also been mean reverting, but the return spreads have narrowed significantly compared to the past two years. The result is more difficulty profiting from risk rotations because investors need to predict more turns, and the gains associated with those turns are smaller. Fundamental factors are delivering stronger and more consistent returns, which is common in economic expansion periods.

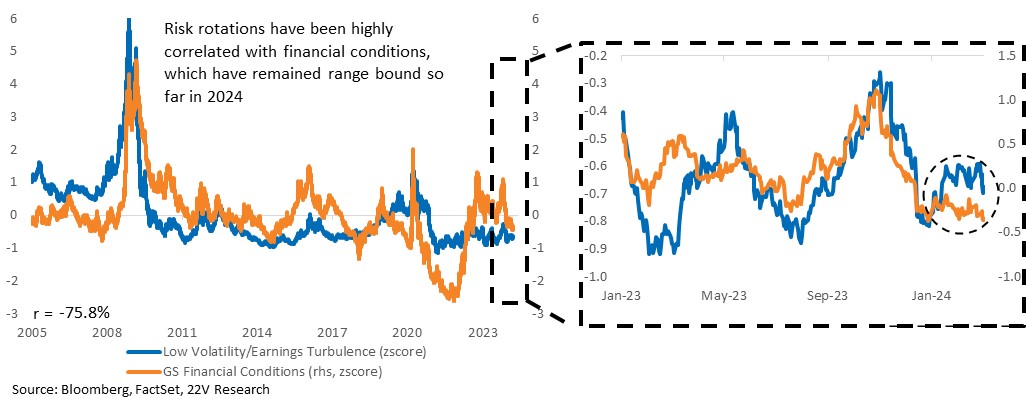
Historically, risk-on vs. risk-off rotations have been a function of financial condition changes, with easing financial conditions supporting risk-on rotations. So far this year, financial conditions have eased, but at a slow pace. The relative stability of financial conditions has helped dampen risk rotations and allows other factors, like shifts in policy expectations, to have a larger impact on risk factors. Overall, inflation and growth data are exerting more influence today. Recent risk-off outperformance has been driven by stronger inflation even as financial conditions remain easy.

Focusing on Low Vol within mega caps shows it has consistently lagged behind all other indices. Investors are willing to take on more risk within mega caps. For other indices, Low Volatility outperformed high Volatility names broadly YTD. That has been especially true for smaller caps, where financial condition influence, specifically credit risk, is higher. Clarity on the outlook for inflation/policy would help determine the path of financial conditions. Stable financial conditions would encourage a rotation out of Low Vol, particularly in the SMID space.

A graph of different colored lines

Description automatically generated

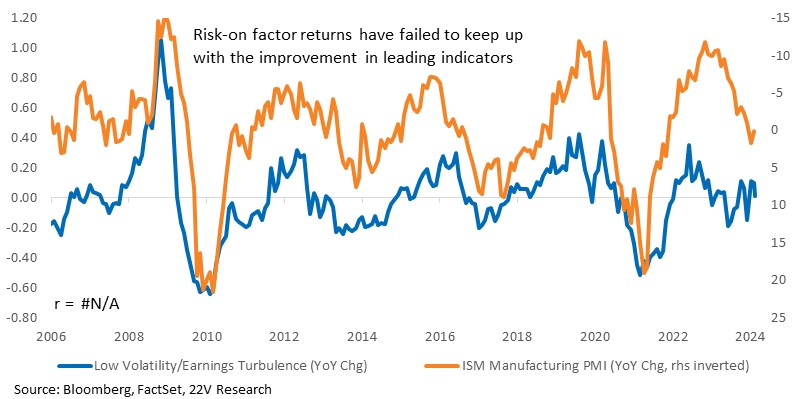
Longer-term, leading indicators also impact risk-on/off factor performance. Stronger PMI readings support risk-on factor gains while falling LEIs encourage risk-off rotations. Currently, Risk-on factors have failed to keep up with the improving momentum of the PMIs. Signs inflation is slowing and that the Fed will not need to tighten financial conditions are necessary before a stronger risk-on rotation is likely.

Divergent Risk Preferences Within Market Caps: Equity markets, particularly at the industry group level, have been mean-reverting this year (HERE). At the factor level, risk factors have also been mean reverting, but the return spreads have narrowed significantly compared to the past two years. In addition, rotations have been shorter than before. The result is more difficulty profiting from risk rotations because investors need to predict more turns, and the gains associated with those turns are smaller. Fundamental factors are delivering stronger and more consistent returns, which is common in economic expansion periods.
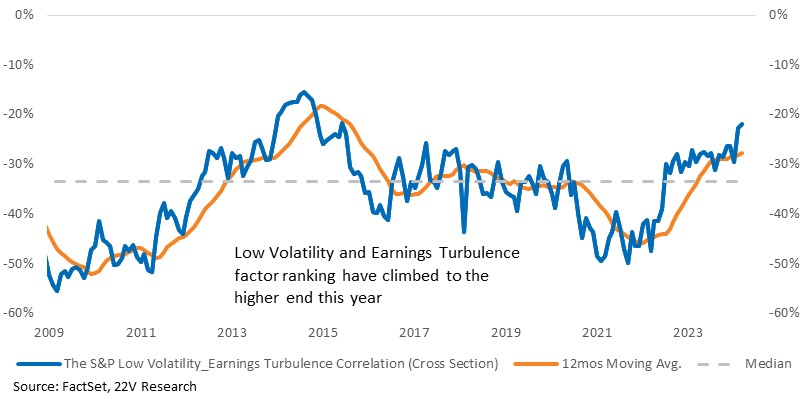
Part of the reason for less return dispersion between Earnings Turbulence/risk-on and Low Volatility/risk-off is that their stock rank correlations have increased to their 90th percentile. The absolute correlation remains negative, but like Value and Growth rankings in early 2023, there is more overlap between risk-on/off rankings than normal, which limits returns during rotations.
Historically, risk-on vs. risk-off rotations have been a function of financial condition changes, with easing financial conditions supporting risk-on rotations. So far this year, financial conditions have eased, but at a slow pace. The relative stability of financial conditions has helped dampen risk rotations and allows other factors, like shifts in policy expectations, to have a larger impact on risk factors. Overall, inflation and growth data are exerting more influence today. Recent risk-off outperformance has been driven by stronger inflation even as financial conditions remain easy.
Longer-term, leading indicators also impact risk-on/off factor performance. Stronger PMI readings support risk-on factor gains while falling LEIs encourage risk-off rotations. Currently, Risk-on factors have failed to keep up with the improving momentum of the PMIs. Signs inflation is slowing and that the Fed will not need to tighten financial conditions are necessary before a stronger risk-on rotation is likely.
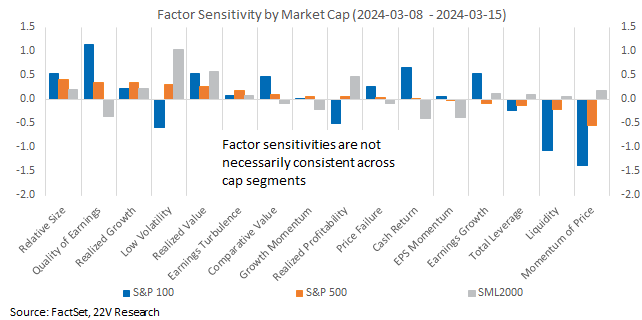
Risk rotations have been inconsistent across market cap segments. Over the past month, small caps with Low Volatility gained more than large caps. Within mega caps, investors slightly favored risk-on names at the expense of Low Volatility. Historical Low Volatility exposure for S&P 500 and S&P 400 have been consistently positive, while the small-caps have negative exposure to Low Volatility. Put another way, smaller cap names tend to be higher beta.
A graph of different colored and black text

Description automatically generated with medium confidence

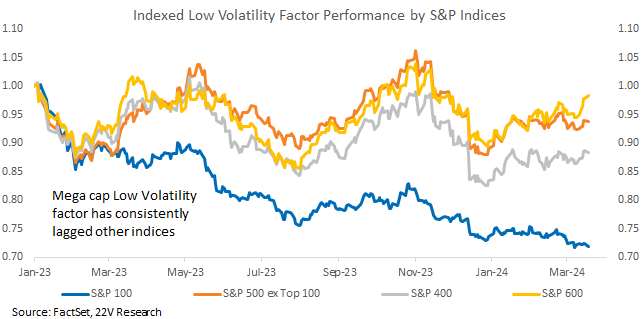
Focusing on Low Vol within mega caps shows it has consistently lagged behind all other indices. Investors are willing to take on more risk within mega caps. For other indices, Low Volatility outperformed high Volatility names broadly YTD. That has been especially true for smaller caps, where financial condition influence, specifically credit risk, is higher.
A graph of different colored lines

Description automatically generated

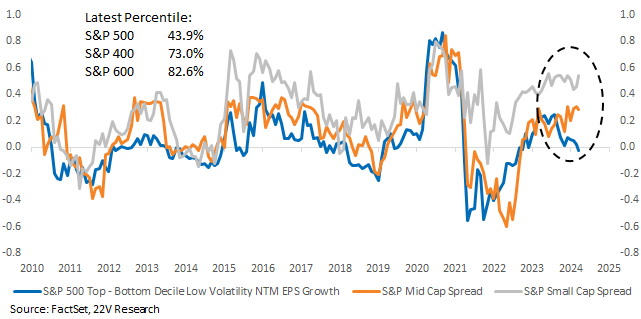
In addition to divergent factor sensitivities, Low Volatility NTM EPS growth expectations have diverged between market caps. For large caps, high volatility names tend to have higher growth expectations, while lower vol small caps have higher NTM EPS growth. That helps explains why profitable names within S&P 600 worked better this year (HERE).
A graph of a graph of a graph

Description automatically generated with medium confidence

DISCLOSURES AND DISCLAIMERS

Analyst Certification

The analyst, 22V Research Group, primarily responsible for the preparation of this research report attests to the following: (1) that the views and opinions rendered in this research report reflect his or her personal views about the subject companies or issuers; and (2) that no part of the research analyst’s compensation was, is, or will be directly related to the specific recommendations or views in this research report.

Analyst Certifications and Independence of Research.

Each of the 22V Research analysts whose names appear on the front page of this report hereby certify that all the views expressed in this Report accurately reflect our personal views about any and all of the subject securities or issuers and that no part of our compensation was, is, or will be, directly or indirectly, related to the specific recommendations or views of in this Report.

22V Research (the “Company”) is an independent research provider. The Company is not a member of the FINRA or the SIPC and is not a registered broker dealer or investment adviser. 22V Research has no other regulated or unregulated business activities which conflict with its provision of independent research.

22V Research, LLC is a professional services and independent publication organization. 22V Research, LLC is not a securities broker-dealer, not a member of the Financial Industry Regulatory Authority (FINRA), not a registered investment advisor (RIA) and not a member of SIPC.

Securities transactions, when offered, are offered by 22V Securities, LLC through LPS Capital, LLC. Certain employees of 22V Securities, LLC are dually registered as securities representatives of LPS Capital, LLC or Analyst Hub Securities, LLC. 22V Securities, LPS Capital and Analyst Hub Securities are members FINRA, SIPC.

https://brokercheck.finra.org/

Current Ratings Definition.

SECTOR OUTPERFORM: An “outperform” rating anticipates the company will outperform the S&P Regional Banking Index (peer group).

SECTOR PERFORM: A “market perform” rating anticipates the company will perform in line with the S&P Regional Banking Index (peer group).

SECTOR UNDERPERFORM: An “underperform” rating anticipates the company will underperform the S&P Regional Banking Index (peer group).

Limitation Of Research And Information.

This Report has been prepared for distribution to only qualified institutional or professional clients of 22V Research Group. The contents of this Report represent the views, opinions, and analyses of its authors. The information contained herein does not constitute financial, legal, tax or any other advice. All third-party data presented herein were obtained from publicly available sources which are believed to be reliable; however, the Company makes no warranty, express or implied, concerning the accuracy or completeness of such information. In no event shall the Company be responsible or liable for the correctness of, or update to, any such material or for any damage or lost opportunities resulting from use of this data. Nothing contained in this Report or any distribution by the Company should be construed as any offer to sell, or any solicitation of an offer to buy, any security or investment. Any research or other material received should not be construed as individualized investment advice. Investment decisions should be made as part of an overall portfolio strategy and you should consult with a professional financial advisor, legal and tax advisor prior to making any investment decision. 22V Research Group shall not be liable for any direct or indirect, incidental or consequential loss or damage (including loss of profits, revenue or goodwill) arising from any investment decisions based on information or research obtained from 22V Research Group.

Reproduction And Distribution Strictly Prohibited.

No user of this Report may reproduce, modify, copy, distribute, sell, resell, transmit, transfer, license, assign or publish the Report itself or any information contained therein. Notwithstanding the foregoing, clients with access to working models are permitted to alter or modify the information contained therein, provided that it is solely for such client’s own use. This Report is not intended to be available or distributed for any purpose that would be deemed unlawful or otherwise prohibited by any local, state, national or international laws or regulations or would otherwise subject the Company to registration or regulation of any kind within such jurisdiction.

Copyrights, Trademarks, Intellectual Property.

22V Research Group, and any logos or marks included in this Report are proprietary materials. The use of such terms and logos and marks without the express written consent of 22V Research Group is strictly prohibited. The copyright in the pages or in the screens of the Report, and in the information and material therein, is proprietary material owned by 22V Research Group unless otherwise indicated. The unauthorized use of any material on this Report may violate numerous statutes, regulations and laws, including, but not limited to, copyright, trademark, trade secret or patent laws.
