

FOMC Preview, Deep Cyclical and Value Catch Up, Non-Growth Chart Spotlight
Bottom Line: Above-trend GDP growth was the reason for higher yields, but now it is more about inflation. As 22V’s economist summed it up (HERE) “the consumer spending boom that held throughout the second half of last year appears now to be abating. But the price data are finally providing some support to the view that the last mile of disinflation will be difficult. This is roughly the opposite mix of what had been in place for the past several months.”
Relevant News: The National Association of Homebuilders Market Index (NAHB) came in at 51, an increase from the prior reading of 48. Improving Homebuilder sentiment is in line with 22V’s economist view that housing is set to be less of a negative contributor to growth.
Things to Watch [Consensus, Results]:
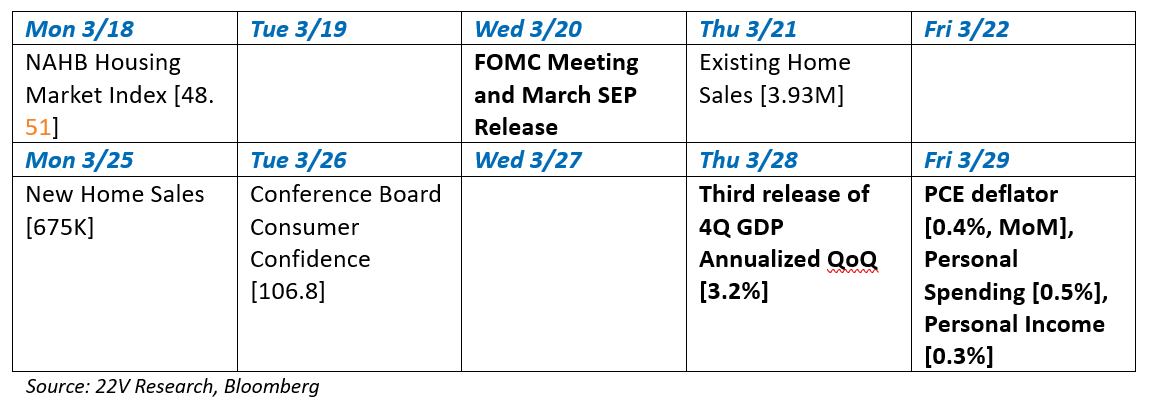
Economics: FOMC Preview
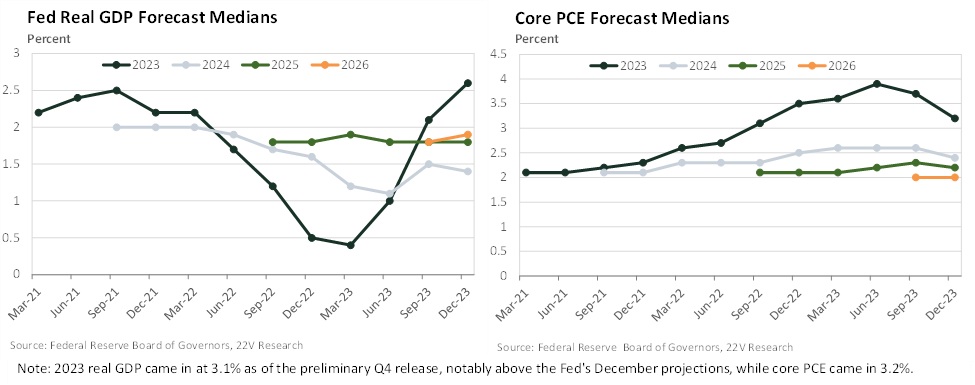
The Federal Reserve will likely increase their 2024 inflation estimate. That’s more of a reaction to hot YTD inflation than a projection of higher inflation the rest of the year. The FOMC will also likely increase the median interest rate levels for 2025-26 by +25bps each. This adjustment reflects a more deliberate, cautious approach toward reaching a neutral interest rate level, resulting in a slower and more gradual descent. Additionally, over the course of the year the long-run dot is likely to shift up by at least 25bps. There has been some recent chatter to suggest this could happen in March but there’s little to force the issue either.
Portfolio Strategy: Deep Cyclicals and Value
Economic demand growth measures are moving back to trend, but inflation measures are sticky. For the latter half of 2023 and through January and parts of February of 2023, inflation surprised to the downside and GDP growth was firm. Consumers experienced a positive real income shock that helped support Early Cyclicals (Tech, Discretionary, Comm Svcs). Deep Cyclicals (Energy, Industrials, and Materials), which we highlighted as a favorite 2024 theme in our Outlook (HERE), have significantly outperformed as real GDP growth appears to be downshifting, but inflation remains sticky. We are not at a point where the Fed needs to tighten financial conditions. If we get to that point, risk assets would come under pressure and deeper Cyclicals would lead to the downside.
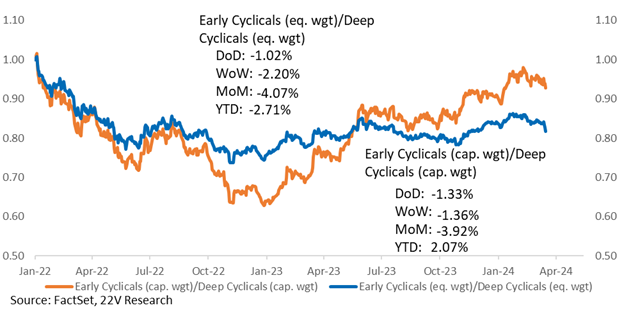
From a factor perspective, last week Low Vol and high Momentum names underperformed while Value gained. Beta adjusted, Low Vol positively contributed to returns, so the factor remained an effective screening tool along with Size, Momentum, and Quality. That means the risk-off tilt of market internals remained in place, but investors were buying higher beta Value names. There is a growing interest in a Value rotation, but it is not yet a broad allocation. That would change if inflation remains sticky to the upside. We think Value continues to catch up and remain long Deep Cyclicals.

Technical Analysis: Non-Growth Chart Spotlight
Non-Growth Index – Weekly – Energy (XLE) + Financials (XLF) + Industrials (XLI) + Materials (XLB) w/ 40-Week MA, Weekly MACD and Growth Relative to S&P 500. The chart in the top panel is in an encouraging position – notice the BASE & Breakout – and has gained for 8 weeks in a row adding 10% in the process. The MACD momentum indicator in the middle panel is still pushing higher. Non-Growth Relative to the S&P, in the bottom panel, is up 4% since the week ending Feb 9, 2024.
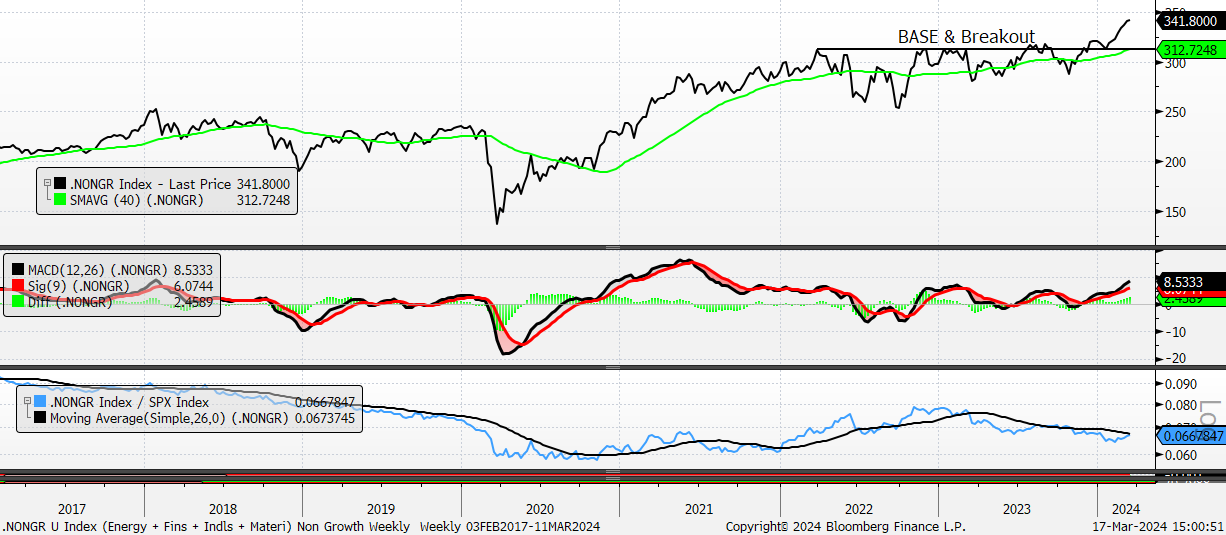
Source: Bloomberg, 22V Research
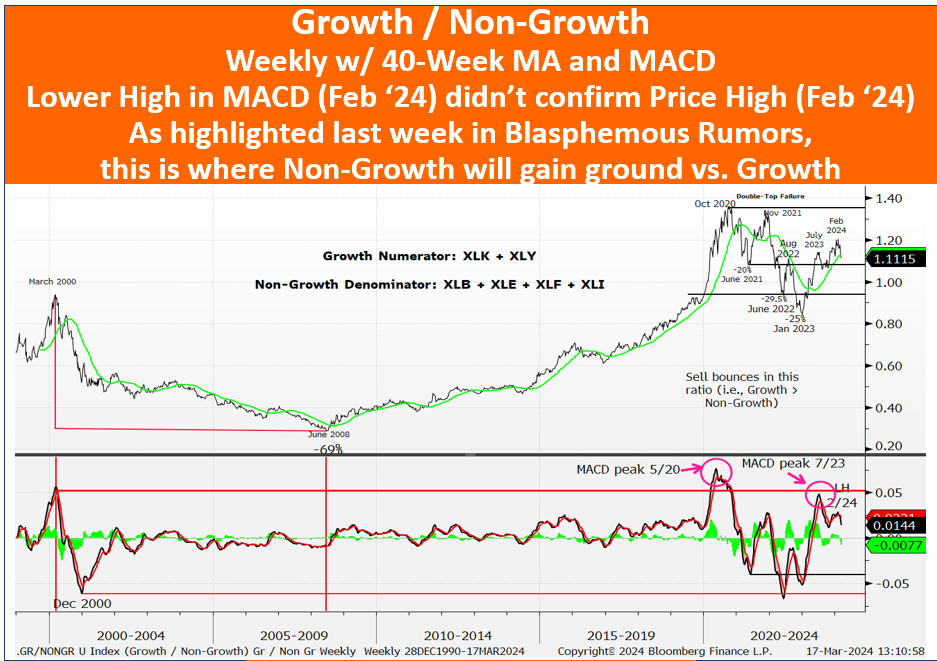
The Growth / Non-Growth Ratio has a Technical Score = 2, Neutral, down from a Technical Score = 3, Good, from one week ago. Recent performance figures for this Ratio look like this on a 1-day (-1.35%), 5-day (-2.39%), 1 month (-4.34%) and a 3-month (-4.15%) basis. And, on a 6 Month basis the Ratio is only up 2.3%. In short, Growth has lost momentum versus Non-Growth and, as the MACD in the lower panel shows, is not oversold. 22V’s technical analyst is looking for Non-Growth to outperform Growth until the MACD in the lower panel gets oversold, bottoms, and turns upward.
Source: Bloomberg, 22V Research

