Back Portfolio Strategy

Supportive PMI Readings + Good and Bad of Earnings So Far

Published on January 25, 2024

∙ Download the PDF Report

By

Dennis DeBusschere

Brian Herlihy

Kevin Brocks

Sophia Wang

SUMMARY: We are surveying investors on eco growth and 1Q EPS ahead of next week’s earnings acceleration and FOMC meeting. We keep these surveys VERY short. You can take it HERE.

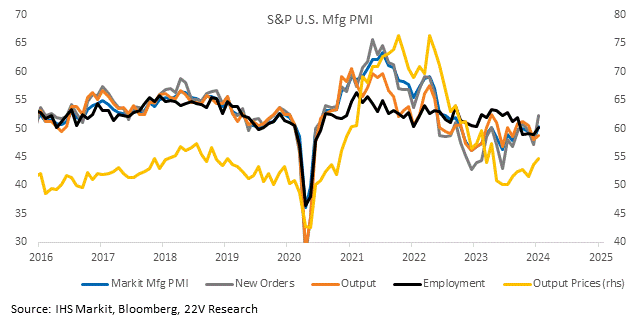
The January prelim S&P manufacturing PMI beat expectations, rising 50.3 (est 47.6). PMI data show manufacturing prices may be bottoming, consistent with Peter’s view that core goods disinflation is set to slow/fade over 1H24. The official writeup flagged improving new business conditions and outlooks several times. That is consistent with the breadth of macro and earnings data and supports a more risk-on backdrop led by Cyclicals and small(er) caps.

The argument AGAINST a risk-on trend that we see most is that labor flow data (like the JOLTS hire rate) show weakening demand. Our pushback is that there was a hiring surge over the past few years. Topline pressures encourage margin preservation that leads to layoffs. BUT stable PMIs, strong new orders, and improving outlooks do not support continued topline pressures going forward. And margins have 1) expanded, and 2) consistently surprised to the upside (they are 10bps stronger than expected early in 4Q23 reporting).
A graph of different colored lines

Description automatically generated

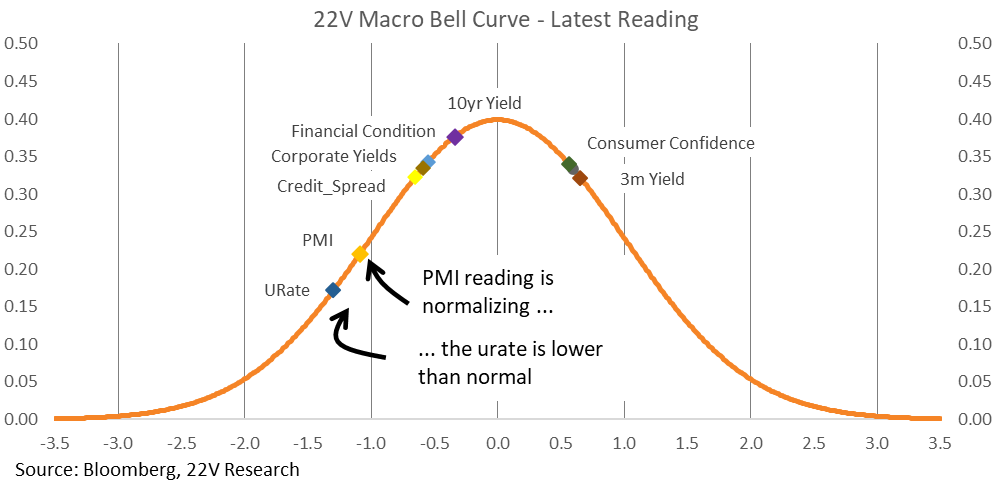
Stable PMIS are one of the factors contributing to our macro regime model’s ‘Growth’ reading (HERE). The macro regime is more sensitive to yields and yield curves, and that’s also where the biggest deviations are between factors and the macro environment. Yield curve futures indicate the 10s2s will be positive at year end, roughly a +50bp steepener. Value is lagging though. YC futures would indicate an even bigger catchup. That supports laggards with a disconnect between performance and macro variables. Check out more on that HERE.

More in the full report below…

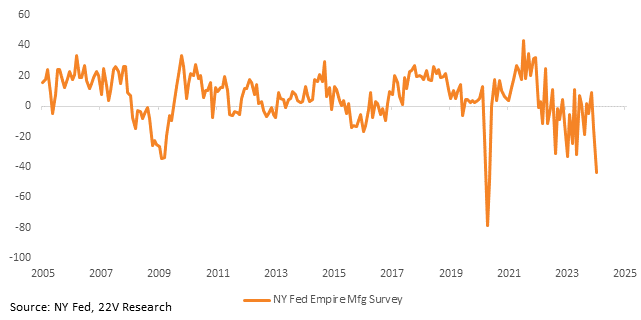
MARKET VIEWS: The preliminary January S&P manufacturing PMI beat expectations yesterday, rising from 47.9 to 50.3 (est 47.6). That was a strong reading and runs counter to weak regional Fed PMIs. Regional surveys have been egregiously volatile post-COVID. Exhibit A – the NY Fed Empire mfg survey is below. It is hard to base any views on a series that volatile.
A graph showing the growth of the company's stock market

Description automatically generated

Peter’s take on the S&P PMI, which is his favorite PMI because of the sample of companies, is that it’s consistent with the troughing and potential bounce in company sentiment. The PMIs show manufacturing prices may be bottoming, consistent with Peter’s view that core goods disinflation is set to slow and mostly fade over 1H24. The official writeup (HERE) flagged improving new business conditions and outlooks several times.

Stable PMIs have contributed to our regime classification model reading ‘Growth.’ The recessionary argument we see most is that labor flow data (like the JOLTS hire rate) show underlying weakness in the labor market. There was a surge in hiring over the past few years, even with slowing growth. Continued topline pressures would eventually mean layoffs to preserve margins. Stable PMIs, strong new orders, and improving outlooks do not support continued topline pressures going forward. And margins have 1) expanded, and 2) consistently surprised to the upside (they are 10bps stronger than expected early in 4Q23 reporting). This all supports a catchup in laggards, particularly those with a disconnect between performance and macro variables. Check out more on that HERE.
A diagram of a graph

Description automatically generated

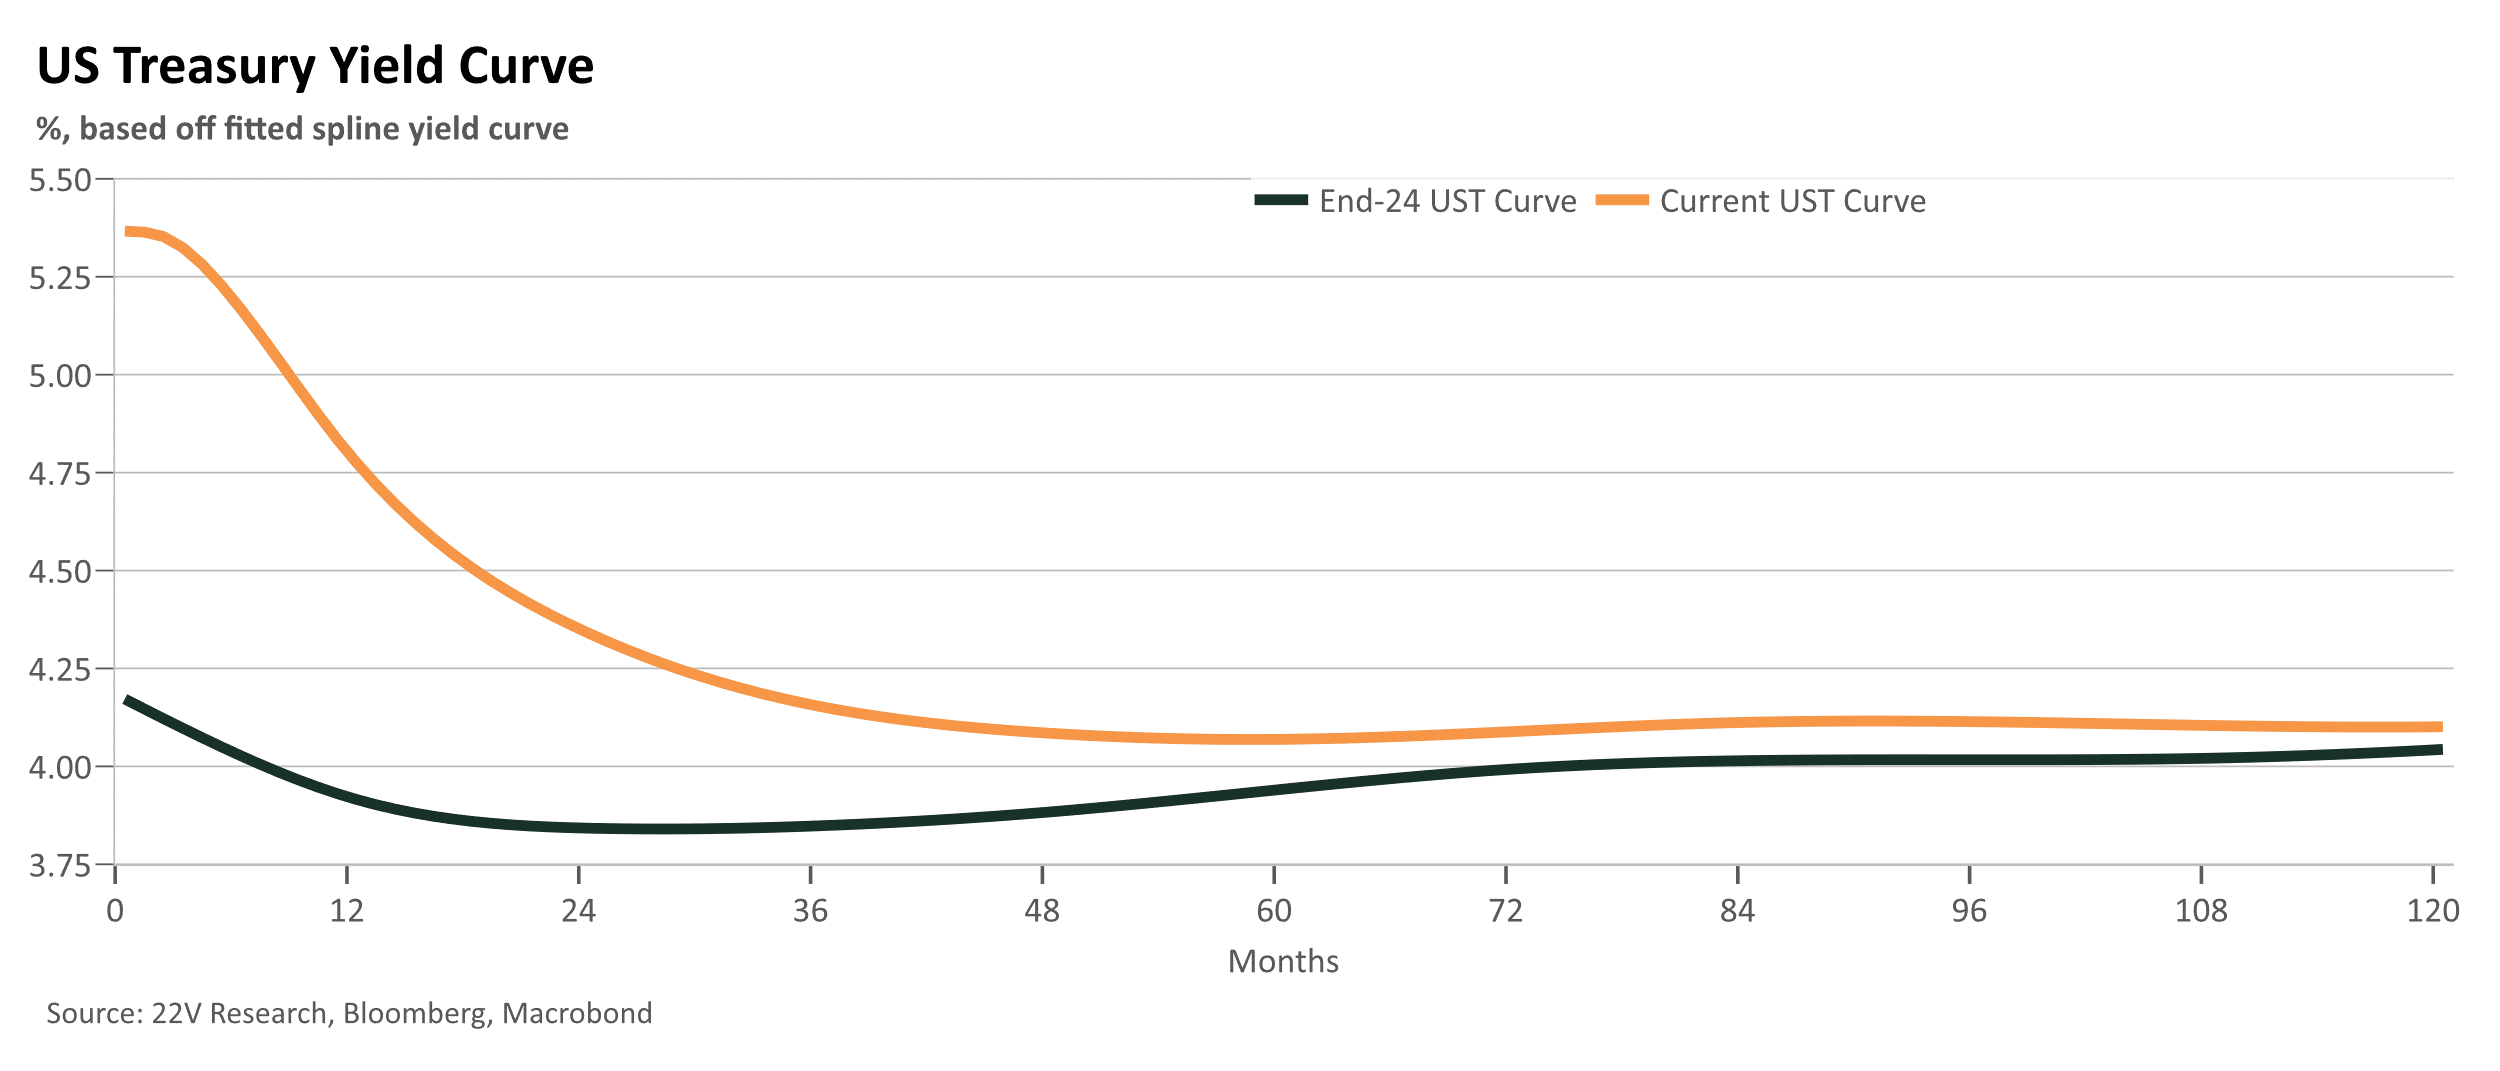
Our macro regime model is much more sensitive to yields and yield curves today, and that is also where there are some of the biggest deviations between factor performance and the macro environment. Yield curve futures indicate the 10s2s will be positive at year end, roughly a +50bp steepener. Value is lagging though. Realization of futures would indicate an even bigger catchup.
A graph of a graph

Description automatically generated with medium confidence

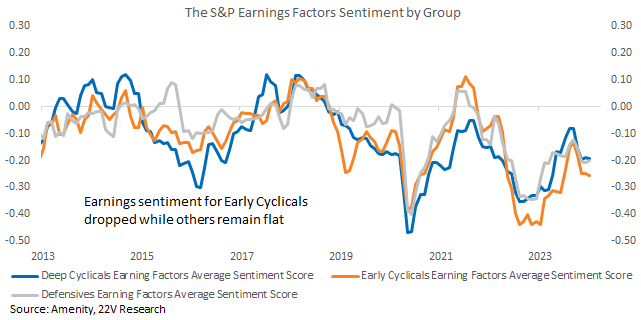
EARLY EARNINGS: Earnings are providing a support for equities as 4Q reporting season speeds up. EPS beat rates are running just under 80% for the S&P, 85% for Financials, 79% for Industrials, and 100% (only 13 companies) for Tech. Earnings sentiment scores have largely stabilized as well, though there has been some weakening of Early Cyclical sentiment. The bottom line is that the macro headwind concerns coming out of 3Q have not shown up in 4Q reporting, setting up for another stronger than expected set of fundamentals. That is good news and is helping catchup laggards and risk-on factors.
A graph of a graph showing the growth of the stocks

Description automatically generated with medium confidence

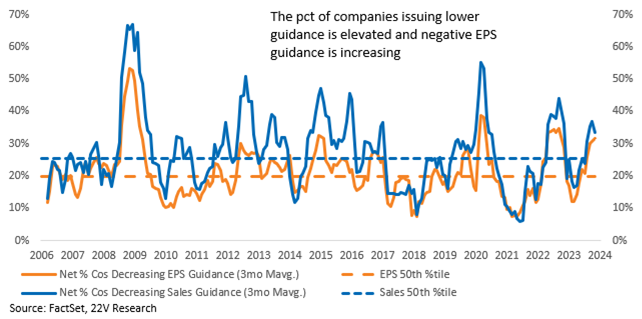
Guidance has been less positive. Net negative sales and earnings guidance levels are at the high end of their normal range and negative EPS guidance is moving higher. Index growth is expected to accelerate into the back half of the year, and weak guidance puts that at risk. Margin sentiment readings are still VERY high, but are rolling over some too. We expect upward revisions to 2024 EPS estimates, in part due to a strong 4Q season that leaves the level of EPS and margins higher than consensus. Earnings need to grow less in 2024 to reach >$240 if final 2023 numbers are $218+ instead of the $216 current expected. What that means is earnings are a support now, but we have to keep a close eye on guidance and sentiment shifts.
A graph of blue and orange lines

Description automatically generated

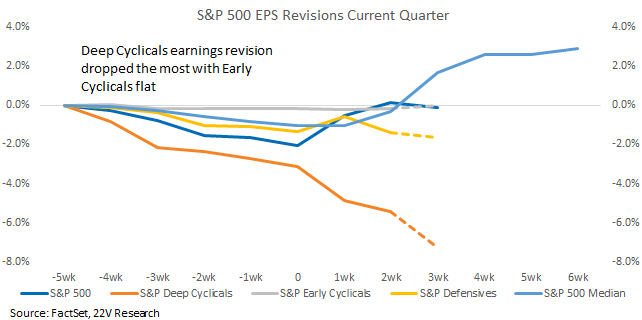
FYI Deep Cyclical revisions are by far the weakest. When revisions are atypically negative, it can signal a problem in the sector/group rather than a larger rebound. The bar for Deep Cyclicals to recover beyond a rebound is high.
A graph of a number of shares

Description automatically generated with medium confidence

DISCLOSURES AND DISCLAIMERS

Analyst Certification

The analyst, 22V Research Group, primarily responsible for the preparation of this research report attests to the following: (1) that the views and opinions rendered in this research report reflect his or her personal views about the subject companies or issuers; and (2) that no part of the research analyst’s compensation was, is, or will be directly related to the specific recommendations or views in this research report.

Analyst Certifications and Independence of Research.

Each of the 22V Research analysts whose names appear on the front page of this report hereby certify that all the views expressed in this Report accurately reflect our personal views about any and all of the subject securities or issuers and that no part of our compensation was, is, or will be, directly or indirectly, related to the specific recommendations or views of in this Report.

22V Research (the “Company”) is an independent research provider. The Company is not a member of the FINRA or the SIPC and is not a registered broker dealer or investment adviser. 22V Research has no other regulated or unregulated business activities which conflict with its provision of independent research.

22V Research, LLC is a professional services and independent publication organization. 22V Research, LLC is not a securities broker-dealer, not a member of the Financial Industry Regulatory Authority (FINRA), not a registered investment advisor (RIA) and not a member of SIPC.

Securities transactions, when offered, are offered by 22V Securities, LLC through LPS Capital, LLC. Certain employees of 22V Securities, LLC are dually registered as securities representatives of LPS Capital, LLC or Analyst Hub Securities, LLC. 22V Securities, LPS Capital and Analyst Hub Securities are members FINRA, SIPC.

https://brokercheck.finra.org/

Current Ratings Definition.

SECTOR OUTPERFORM: An “outperform” rating anticipates the company will outperform the S&P Regional Banking Index (peer group).

SECTOR PERFORM: A “market perform” rating anticipates the company will perform in line with the S&P Regional Banking Index (peer group).

SECTOR UNDERPERFORM: An “underperform” rating anticipates the company will underperform the S&P Regional Banking Index (peer group).

Limitation Of Research And Information.

This Report has been prepared for distribution to only qualified institutional or professional clients of 22V Research Group. The contents of this Report represent the views, opinions, and analyses of its authors. The information contained herein does not constitute financial, legal, tax or any other advice. All third-party data presented herein were obtained from publicly available sources which are believed to be reliable; however, the Company makes no warranty, express or implied, concerning the accuracy or completeness of such information. In no event shall the Company be responsible or liable for the correctness of, or update to, any such material or for any damage or lost opportunities resulting from use of this data. Nothing contained in this Report or any distribution by the Company should be construed as any offer to sell, or any solicitation of an offer to buy, any security or investment. Any research or other material received should not be construed as individualized investment advice. Investment decisions should be made as part of an overall portfolio strategy and you should consult with a professional financial advisor, legal and tax advisor prior to making any investment decision. 22V Research Group shall not be liable for any direct or indirect, incidental or consequential loss or damage (including loss of profits, revenue or goodwill) arising from any investment decisions based on information or research obtained from 22V Research Group.

Reproduction And Distribution Strictly Prohibited.

No user of this Report may reproduce, modify, copy, distribute, sell, resell, transmit, transfer, license, assign or publish the Report itself or any information contained therein. Notwithstanding the foregoing, clients with access to working models are permitted to alter or modify the information contained therein, provided that it is solely for such client’s own use. This Report is not intended to be available or distributed for any purpose that would be deemed unlawful or otherwise prohibited by any local, state, national or international laws or regulations or would otherwise subject the Company to registration or regulation of any kind within such jurisdiction.

Copyrights, Trademarks, Intellectual Property.

22V Research Group, and any logos or marks included in this Report are proprietary materials. The use of such terms and logos and marks without the express written consent of 22V Research Group is strictly prohibited. The copyright in the pages or in the screens of the Report, and in the information and material therein, is proprietary material owned by 22V Research Group unless otherwise indicated. The unauthorized use of any material on this Report may violate numerous statutes, regulations and laws, including, but not limited to, copyright, trademark, trade secret or patent laws.
