SUMMARY
China’s activity data for August affirmed the signs of tentative stabilization that had been suggested by initial data releases for the month, such as PMIs and credit [link to our preview note HERE]. Industrial production and retail sales improved notably from July and beat consensus expectations by a wide margin. Fixed asset investment showed the continued drag from property, but nonetheless improved sequentially and should benefit in coming months from a pickup in infrastructure stimulus.
In all, August data suggest that China’s economy has bottomed out and that the tail risks of a sharp further deterioration are contained. Incremental stimulus rolled out since late July is starting to show an impact. At the same time, it would be premature to conclude that the recovery is on solid footing. Growth for key indicators is still weak by historical standards and this marks one month of improvement in a rebound that has seen setbacks. Demand for China’s exports remains subdued and, most importantly, a strong recovery will require further improvement in private sector confidence and in the property sector, which is still highly uncertain. Given a restrained policy stance and debt risks in property and local government finances, China is not yet out of danger from an anemic recovery and extended malaise.
Please see HERE for a short video that discusses the key highlights and takeaways, also detailed below.
DETAILS:
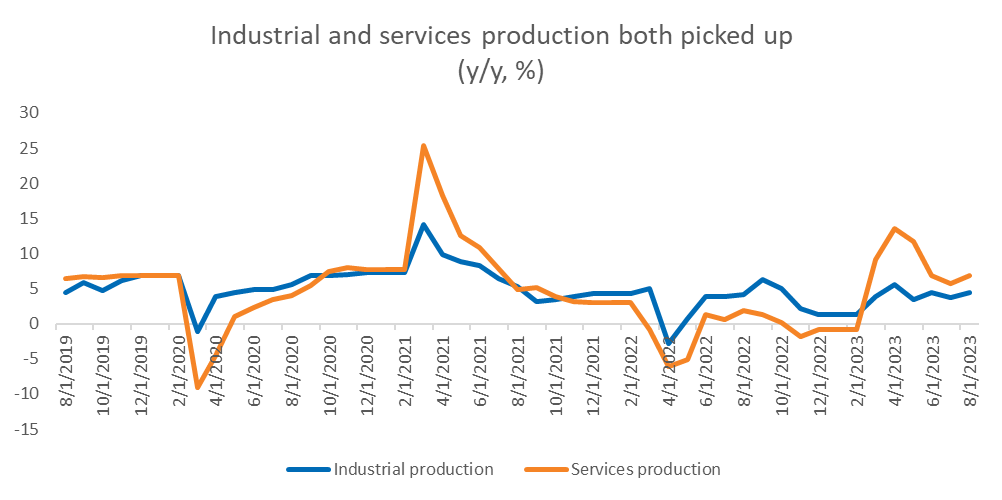
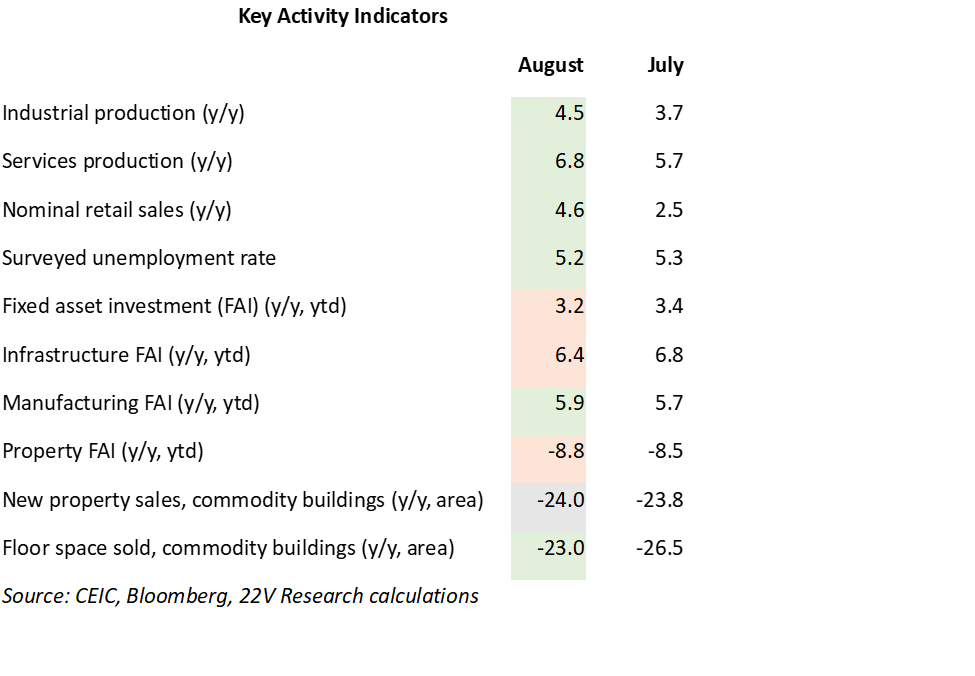
- Industrial production grew 4.5% y/y in August, significantly better than the Bloomberg consensus forecast of 3.9% and the 3.7% y/y growth in July. It also improved month-over-month (0.5% vs 0.01% in July). Services production had seemed likely to decelerate but instead picked up to 6.8% y/y from 5.7% in March.
- Fixed asset investment (FAI) slowed to 3.2% y/y for Jan-August (slightly below expectations), from 3.4% y/y in Jan-July. Still, it expanded month-over-month for the first time in two months. Infrastructure FAI remained the main driver (6.4% y/y in Jan-August, from 6.8% in Jan-July) but doesn’t yet show much of an impact from a pickup in local government issuance of bonds to fund infrastructure investment; this is likely to show up in September and October data, though the scale will depend on how much support the central government provides to local governments (see watchpoints below). Manufacturing FAI picked up to 5.9% y/y Jan-Aug., from 5.7% y/y in Jan-July, in a sign that private sector confidence may be improving and destocking easing.
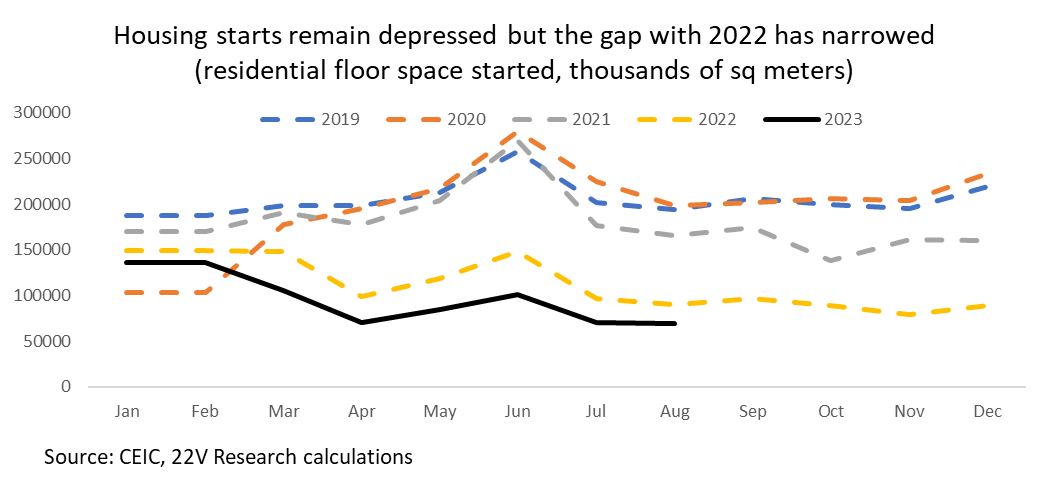
- The big drag on investment remained property FAI, which saw a steepening contraction (8.8% y/y in Jan-August, vs. 8.5% in Jan-July). Floor space sold (measured by volume) fell by -24% y/y, which was steady with y/y growth in July, while new housing starts saw a narrowing contraction at -23% y/y from -26.5% y/y in July. At the same time, property prices for new homes fell month-over-month for a third straight month, a worrying trend given the potential for those dynamics to worsen household sentiment – and this is the official price series, which understates the degree of actual declines. Note that August data do not reflect a recent spate of easing measures whose impact remains uncertain (see watchpoints below).
- Nominal retail sales surprised to the upside at 4.6% y/y, compared to 2.5% y/y in July and the consensus of 3% y/y. Spending on goods picked up to 3.7% y/y from only 1% y/y in July. The team at Bloomberg Economics noted that the improvement in retail sales benefitted from a spike in sales and price increases for jewelry, makeup and petroleum products rather than necessarily signifying a broad rebound (jewelry and makeup reflect strength in luxury spending, while petroleum sales are a reminder that China’s retail sales include purchases by governments and some firms and are not a pure reflection of household consumption). What we have been looking for most in this series is signs that households are confident and flush enough to make big ticket goods purchases, and the readings were mixed. Appliances and anything related to housing remain in the doldrums. However, auto sales improved, particularly when one looks at two-year growth to strip out a large base effect from last year: the two-year compound growth rate improved to 8.2% in August from 3.9% in July. The surveyed employment rate improved to 5.2%, from 5.3% in July, though insight into youth unemployment remains limited given Beijing’s move last month to stop reporting the data. In short, retail sales suggest some stabilization in end-demand for households, but thus far still at subdued levels.
Key watchpoints in coming weeks:
- Property, property and property: It will be very important to see if easing measures rolled out from late August start to revive sales and sentiment. Tier 1 cities (Beijing, Shanghai, Guangzhou and Shenzhen) saw an initial surge of interest from buyers at the start of the month but some recent reports suggest that may have already fizzled out. While a recovery in tier 1 would be welcome, the outlook for the national market (especially tier 3 and tier 4) remains dim and it isn’t clear if the authorities’ steps will be enough to bring stability to the sector given: (1) a still weak macro environment for households; (2) household concerns that prices may not have stabilized; (3) continued debt woes for developers, which weigh on household willingness to pre-buy apartments; and (4) demographic constraints on real demand for housing.
- Infrastructure stimulus and local government debt risks: Local governments have until end-September to issue their annual allotment of “special bonds” to finance infrastructure. While this will provide support to commodity demand in coming months, a key pending question is whether the central bank will provide additional funding (as it did last year) given local government debt burdens. That amount of such support (expectations are for roughly RMB 500 bn) will be important for determining how much infrastructure investment can offset the continued drag from property. It will also be important to see how Beijing handles mounting debt repayment pressures for local government financing vehicles, a source of potential financial stability risks and a weight on local government spending.
- Policy support and signaling: We do not think that the data today is so positive as to tempt Beijing to dial back the pace of incremental stimulus measures in the short term. Still, the degree of policy support remains critical for the recovery and it will be important to see continued follow through. Fiscal spending is still contractionary this year and Beijing is intent to stay disciplined given local government debt burdens. Monetary policy has been more forceful but the PBOC is still managing pressures on the exchange rate. The question remains as to whether China’s leadership will ease policy enough to get the recovery on solid footing or be content with stability at relatively anemic levels. Beijing is also still struggling to gain traction in its efforts to reassure the private sector (and foreign business community) regarding the investment environment amid Xi Jinping’s continued focus on national security and tight political and ideological controls.