Back Portfolio Strategy

CPI Support Continuation of the Risk-On Rally and Small Cap Rebound + 2024 Risks

Published on July 13, 2023

∙ Download the PDF Report

By

Dennis DeBusschere

Brian Herlihy

Kevin Brocks

Sophia Wang

SUMMARY: With the small increase in “super core” inflation (core CPI ex auto and rents) it is increasingly clear the Fed will pause after raising 25 basis points this month. The sharp decline in 2yr yields and fed funds futures confirms that view. The “easy” part of disinflation has happened and now we are on to the second stage. The second stage might be much more difficult if wages stay elevated, but that is a worry for 4Q23, when inflation comps become more difficult. For now, the backdrop is one where inflation is declining from a very high level, but is less of an immediate concern for the Fed (financial conditions don’t tighten). At the same time, economic data is non-recessionary. That is supportive of risk-on internals (small caps, deep Cyclicals, retail, transports, and Earnings Turbulence names).

A graph of a graph with blue and orange lines

Description automatically generated

Earnings are the next swing factor. The absolute level of inflation remains high and implies less downside risk to revenue growth and margins this quarter. Recent gains in margins/earnings sentiment indicate another quarter of flat to modestly higher margins, likely keeping the risk-on trade intact short-term. However, profitability is expected to accelerate into the end of the year and improve significantly in 2024. Below trend GDP growth for longer, which is required to push core inflation lower, increases the risk of negative revisions to 2024 estimates.

FYI, Brian Herlihy, our head of Quant Research, is hosting his quarterly earnings preview today at 2 PM ET. It’ll be no more than 30mins. Registration link HERE.

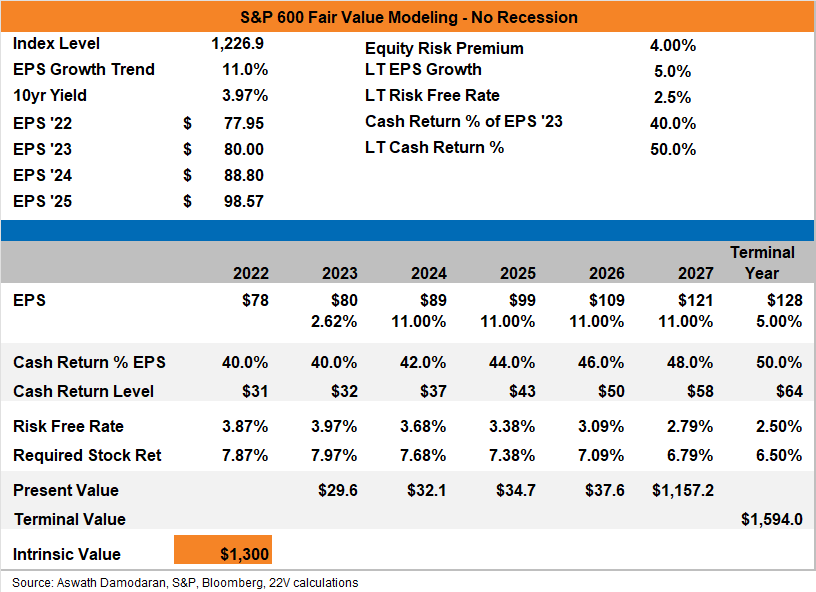
SMALL CAP FAIR VALUE: As we mentioned yesterday (HERE), we like small caps relative to large caps. Small caps have a more risk-on factor profile and benefit from a more optimistic economic narrative. Small caps are somewhat attractive on an absolute basis under a no recession scenario. Applying the same fair value framework to the S&P 600 that we use on the 500, fair value, with no recession, is ~1,300, or about +7% from here.

We walk through the fair value calculation and assumptions we make in the full report below…

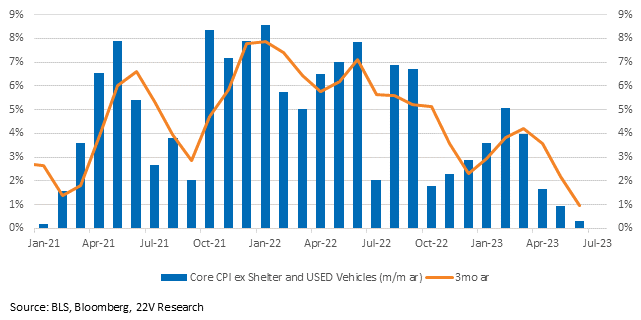
MARKET VIEWS: The CPI report was favorable for risk assets. Super core only rose +3bps m/m (consensus was +46bps). Gerard thinks “it is increasingly clear that the Fed will pause after raising 25 basis points this month” and that the rate reaction is justified (2yr -13bps, an 8th %tile move). We’d be careful extrapolating CPI in a volatile data backdrop. The second stage of disinflation will probably still be more difficult and will probably still require further loosening of the labor market. For now, though, the data is another support to the risk-on trend. It’s difficult to step in front of that trend for a disinflation problem that will play out later this year.
A graph of a graph with blue and orange lines

Description automatically generated

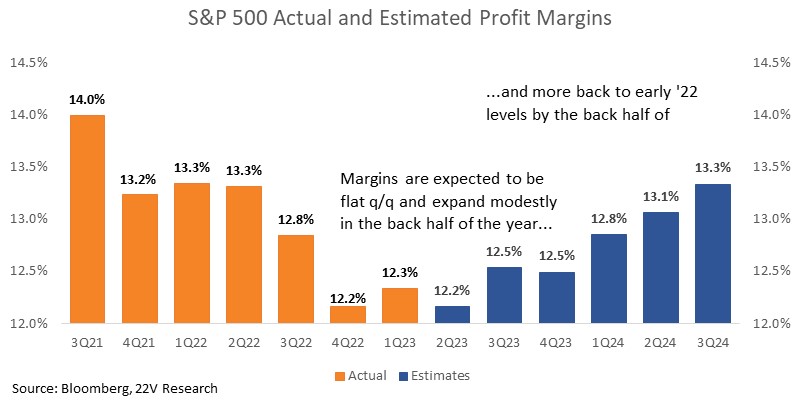
Earnings are the next swing factor. the absolute level of inflation remains much too high (core CPI 4.8% y/y), which has two implications related to earnings. 1) There is less downside risk to revenue growth and margins this quarter, and 2) because the Fed cannot allow growth to accelerate meaningfully, medium-term EPS growth trend will remain under pressure. Recent gains in margins/earnings sentiment indicate another quarter of flat to modestly higher margins, likely keeping the risk-on trade intact short-term. However, profitability is expected to accelerate into the end of the year and take off in 2024. With rates higher for longer, growth slower for longer, and core services inflation biased lower, there is a growing risk of negative revisions to 2024 estimates.
A graph of blue and orange bars

Description automatically generated

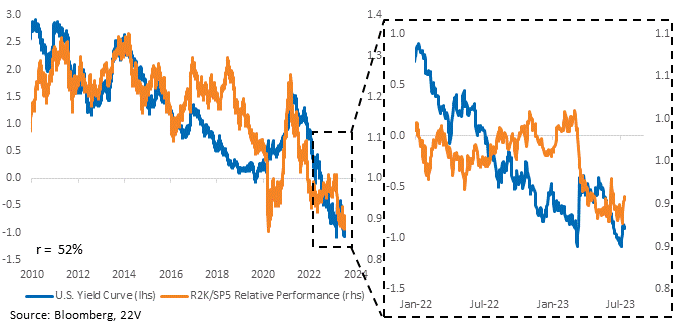
SMALL CAP FAIR VALUE: As we mentioned yesterday (HERE), we like small caps relative to large caps. Small caps have a more risk-on factor profile and benefit from a more optimistic economic narrative. The Russell has outperformed the S&P by +3.5pp while the yield curve has steepened +19bps over the past week.
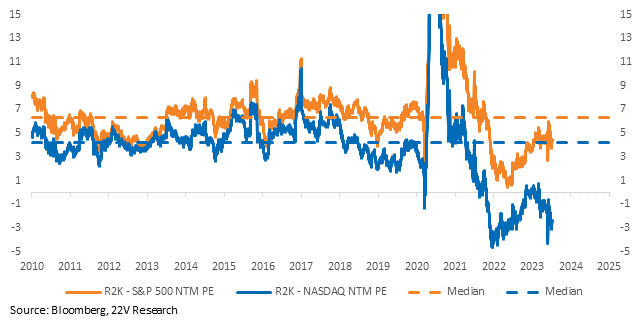
The performance and valuation gap between small and large caps after mega caps outperformed to start 2023 has gotten extreme, something we are wary of in a mean-reverting market. Small caps PEs have recovered some but are still below their medians relative to SPX and NDX. And performance spreads after the beginning of 2023 had only been outdone in the tech bubble and COVID.
A graph of blue and orange lines

Description automatically generated

Small caps are somewhat attractive on an absolute basis under a no recession scenario. Applying the same fair value framework to the S&P 600 that we use on the 500, fair value, with no recession, is ~1,300, or about +7% from here. FYI the fair value calculation we use is based on valuation guru Aswath Damodaran’s work (HERE). It’s a cash return model, akin to valuing a single stock with a DCF model. The calc is based on an expected earnings path, risk free rate (10yr), cash return (historical comp), and equity risk premium (excess return investors are demanding for taking risk). We walk through the assumptions below…
A screenshot of a graph

Description automatically generated

Assumptions:

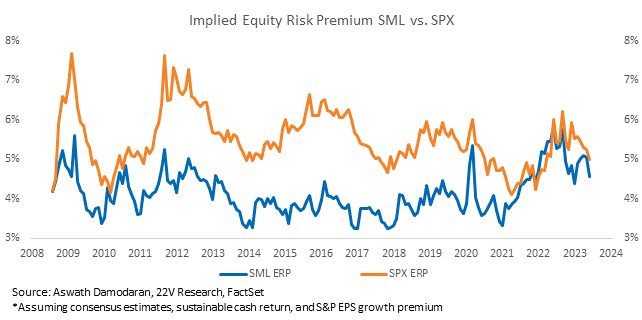
ERP is the non-recession median.

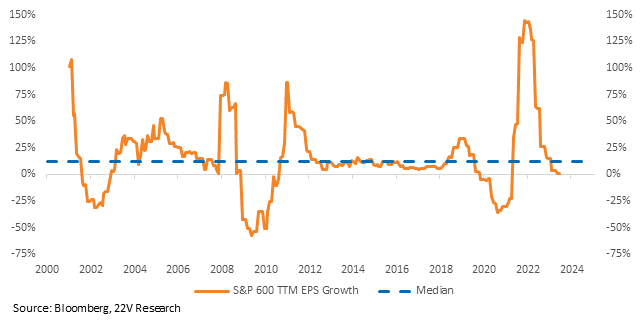
EPS growth trend is the long-term median.

EPS estimates are consensus this year, trend growth rest of the way.

LT EPS growth falls towards the long-term risk-free rate. Since small cap earnings growth is usually better, we bump long-term eps to 5%.

LT cash return ratio is the long-term median.

Cash return this year is knocked down a bit because economic growth is stable but below trend.

Small cap earnings are extremely volatile, so we use the median growth rate assuming that that’ll be the result of whatever swing happens. Plus, there isn’t the same base effect to get a +100% eps growth as can happen in recoveries.
A graph of a graph showing the growth of the stock market

Description automatically generated

FYI the ERP for small caps is usually lower than the S&P 500 because small caps return less cash than large caps. So, investors demand a lower cash return yield from small caps relative to the risk-free rate.
A graph of blue and orange lines

Description automatically generated

DISCLOSURES AND DISCLAIMERS

Analyst Certification

The analyst, 22V Research Group, primarily responsible for the preparation of this research report attests to the following: (1) that the views and opinions rendered in this research report reflect his or her personal views about the subject companies or issuers; and (2) that no part of the research analyst’s compensation was, is, or will be directly related to the specific recommendations or views in this research report.

Analyst Certifications and Independence of Research.

Each of the 22V Research analysts whose names appear on the front page of this report hereby certify that all the views expressed in this Report accurately reflect our personal views about any and all of the subject securities or issuers and that no part of our compensation was, is, or will be, directly or indirectly, related to the specific recommendations or views of in this Report.

22V Research (the “Company”) is an independent research provider. The Company is not a member of the FINRA or the SIPC and is not a registered broker dealer or investment adviser. 22V Research has no other regulated or unregulated business activities which conflict with its provision of independent research.

22V Research, LLC is a professional services and independent publication organization. 22V Research, LLC is not a securities broker-dealer, not a member of the Financial Industry Regulatory Authority (FINRA), not a registered investment advisor (RIA) and not a member of SIPC.

Securities transactions, when offered, are offered by 22V Securities, LLC through LPS Capital, LLC. Certain employees of 22V Securities, LLC are dually registered as securities representatives of LPS Capital, LLC or Analyst Hub Securities, LLC. 22V Securities, LPS Capital and Analyst Hub Securities are members FINRA, SIPC.

https://brokercheck.finra.org/

Current Ratings Definition.

SECTOR OUTPERFORM: An “outperform” rating anticipates the company will outperform the S&P Regional Banking Index (peer group).

SECTOR PERFORM: A “market perform” rating anticipates the company will perform in line with the S&P Regional Banking Index (peer group).

SECTOR UNDERPERFORM: An “underperform” rating anticipates the company will underperform the S&P Regional Banking Index (peer group).

Limitation Of Research And Information.

This Report has been prepared for distribution to only qualified institutional or professional clients of 22V Research Group. The contents of this Report represent the views, opinions, and analyses of its authors. The information contained herein does not constitute financial, legal, tax or any other advice. All third-party data presented herein were obtained from publicly available sources which are believed to be reliable; however, the Company makes no warranty, express or implied, concerning the accuracy or completeness of such information. In no event shall the Company be responsible or liable for the correctness of, or update to, any such material or for any damage or lost opportunities resulting from use of this data. Nothing contained in this Report or any distribution by the Company should be construed as any offer to sell, or any solicitation of an offer to buy, any security or investment. Any research or other material received should not be construed as individualized investment advice. Investment decisions should be made as part of an overall portfolio strategy and you should consult with a professional financial advisor, legal and tax advisor prior to making any investment decision. 22V Research Group shall not be liable for any direct or indirect, incidental or consequential loss or damage (including loss of profits, revenue or goodwill) arising from any investment decisions based on information or research obtained from 22V Research Group.

Reproduction And Distribution Strictly Prohibited.

No user of this Report may reproduce, modify, copy, distribute, sell, resell, transmit, transfer, license, assign or publish the Report itself or any information contained therein. Notwithstanding the foregoing, clients with access to working models are permitted to alter or modify the information contained therein, provided that it is solely for such client’s own use. This Report is not intended to be available or distributed for any purpose that would be deemed unlawful or otherwise prohibited by any local, state, national or international laws or regulations or would otherwise subject the Company to registration or regulation of any kind within such jurisdiction.

Copyrights, Trademarks, Intellectual Property.

22V Research Group, and any logos or marks included in this Report are proprietary materials. The use of such terms and logos and marks without the express written consent of 22V Research Group is strictly prohibited. The copyright in the pages or in the screens of the Report, and in the information and material therein, is proprietary material owned by 22V Research Group unless otherwise indicated. The unauthorized use of any material on this Report may violate numerous statutes, regulations and laws, including, but not limited to, copyright, trademark, trade secret or patent laws.
