SUMMARY: The core services CPI number yesterday was easily low enough for the Fed to skip today and the median interest rate dot, from the Summary of Economic Projections, for the end of this year to come up 25bp. The risk of a 50bp hike is largely eliminated. The Fed could still easily go another 50bp this year, but there is no need to signal that today. Which is to say the Fed is data dependent and unless the data suggests more urgency to tighten financial conditions and slow growth faster, expect financial conditions to remain around current levels.
After reaching a cycle low in October, the S&P rallied 21%, moving away from the bear market (we are NOT saying it is over, just pointing out the move). Market internals are reflecting increased soft landing expectations and are broadly aligned with the extremely long Transition period classified by our Macro Regime Model (details HERE). From the peak to now, the market trend does not line up well with either historical recessions or short-term bear markets. Mean reversion is still the market paradigm until the transition period breaks one way or the other.

Higher R* Thought: Below is an argument that could help explain what is going on with the economy and markets. We don’t have high conviction, but the idea is plausible and likely to get overpriced. Even if there is truth to it.
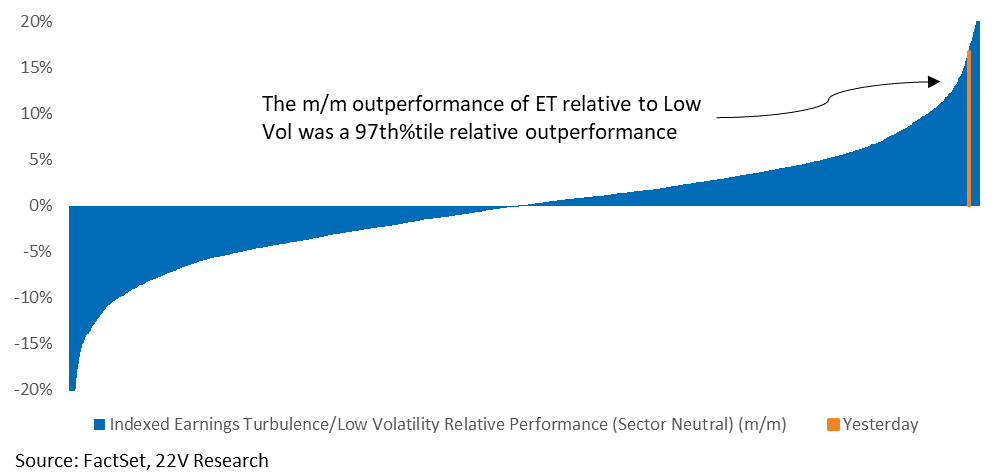
If the economy is ok and inflation is slowly moving lower (maybe not low enough. That is an issue for another day) with a 5% fed funds rate, that indicates investors think R* (the equilibrium fed funds rate) is higher. Earnings Turbulence names had a 97th %tile MoM move relative to Low Vol as UST yields increased. Stocks that benefit from lower correlations have outperformed significantly too. Both suggest the economy can “live” with a 5% fed funds. At least for now.
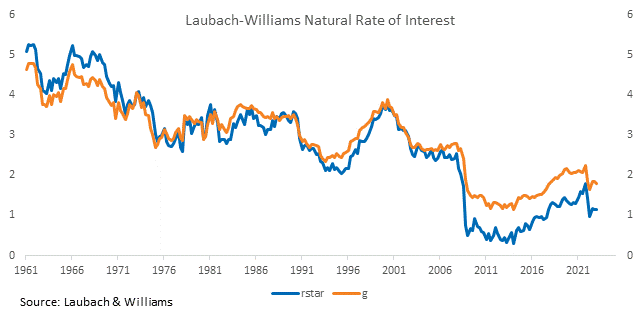
A reason why R* and estimates of G (trend growth) could be higher are 1) higher debt to GDP ratios, 2) extremely positive net worth effects (HERE), 3) the recent persistence of lower savings rates, and 4) a consumer that is not particularly credit dependent (HERE). That is why employment has remained firm. Much higher employment would significantly increase recession risk. The reasons R* might be higher are the same reasons we have consistently pushed back on near-term recession risk and dire earnings forecasts.
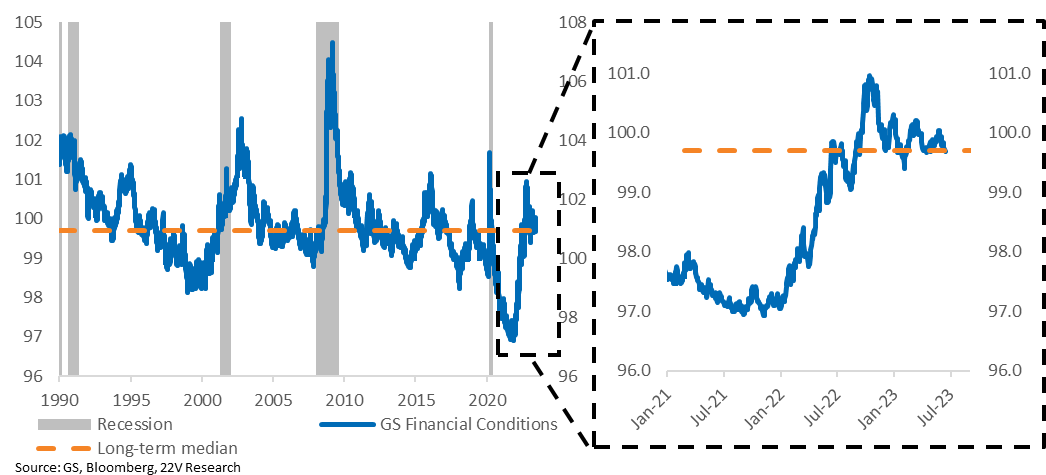
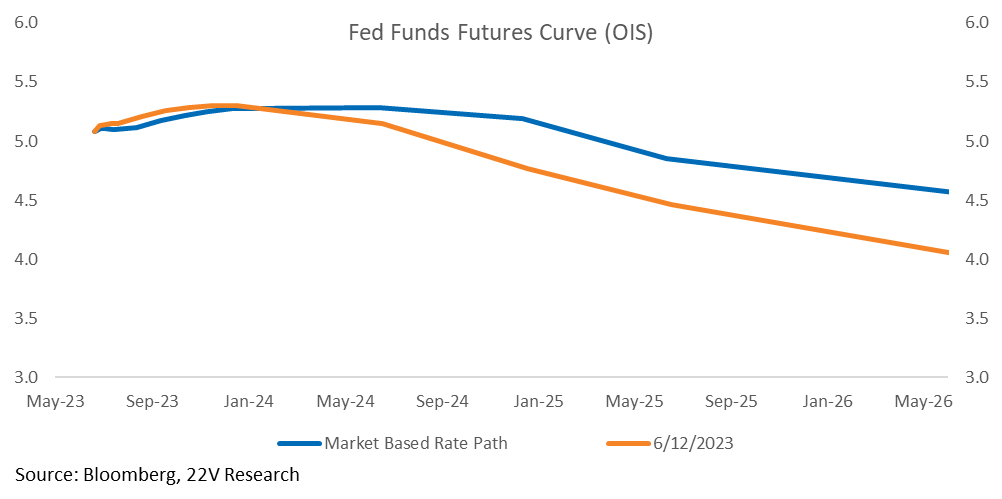
A simple way to think about the higher R* point is this. The Fed believes monetary policy operates on aggregate demand, and thus inflation, through financial conditions and not just the level of the fed funds rate. We can reasonably assume financial conditions have taken into account the current shape of the Fed funds futures curve (rates between 5%-4.5% between now and May 2026!!). And yet financial conditions have basically “normalized” back to post-GFC levels when the Fed funds rate was at or close to zero.
It might prove over time that 1) fed funds need to be much higher to tighten financial conditions more, or 2) 5% is restrictive and it will just take time to figure out. The first option seems more likely to us, but having conviction in ANY outcome is really hard. That is why we are fading extreme moves and narrative shifts and might have to eventually fade the higher R* idea.
Full report below…
MARKET VIEWS: Adjusting for the noise in the CPI yesterday (netting out used car and lagging rent data) and the core services number from CPI was easily low enough for the Fed to skip today. As for the Summary of Economic Projections are concerned, as Gerard highlighted (HERE), “the median interest rate dot for the end of this year comes up 25 basis points and the risk of it rising 50 is largely eliminated. The Fed can easily go another 50 this year, but there is no need to signal that now.” If Gerard is correct, then the Fed will have changed the dot corresponding to the end of 2023 seven times for a total of eight guesses. Which is to say they are data dependent unless the data suggests more urgency to tighten financial conditions and slow growth faster. Expect financial conditions to remain around current levels, making a short the market call tough.
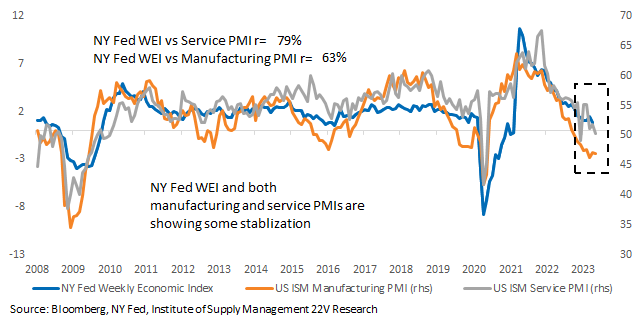
Macro readings are still telling a confusing story, but yesterday’s CPI report and recent high-frequency data point to increased odds of a soft landing. The NY Fed Weekly Economic Index has stalled at a low level this year, and the Manufacturing PMI has stabilized over the past two months. Growth has slowed but has not collapsed. On the inflation front, Core CPI ex rent and autos slid lower yesterday, and the latest unemployment rate jumped to 3.7% while the average workweek declined. Slow but stable growth plus easing inflation creates room for a less hawkish Fed today and continues supporting a soft-landing narrative.
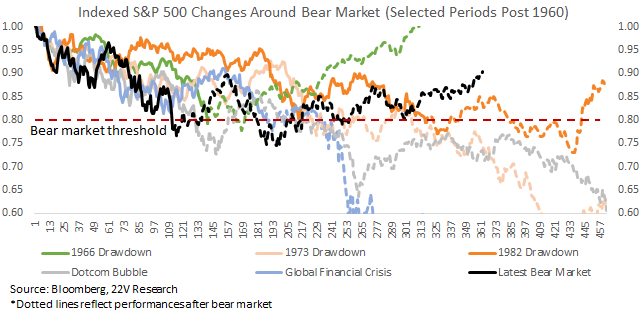
After reaching a cycle low in October, the S&P has rallied 21%, moving away from the bear market (we are NOT saying it is over, just pointing out the move). Market internals are reflecting increased soft landing expectations and are broadly aligned with the extremely long Transition period classified by our Macro Regime Model (details HERE). From the peak to now, the market trend does not line up well with either historical recessions or short-term bear markets.
Higher R* Thoughts: Consistent with what we pointed out above, credit spreads have tightened and stocks have gone up despite a surge in UST yields (especially yesterday). That indicates a soft/no landing odds increased. If the economy is ok and inflation is moving lower (maybe not low enough. That is a topic for another day) with a 5% fed funds rate, that would indicate investors think R* (the equilibrium fed funds rate) is higher. High Earnings Turbulence names have had a 97th%tile MoM move relative to the Low Vol as UST yields have increased. Stocks that benefit from lower correlations have outperformed significantly as well. Both suggest the economy can “live” with 5% fed funds. At least for now.
A reason why R* and estimates of G (trend growth) would be higher are higher debt to GDP ratio’s, extreme positive net worth effects (HERE), the recent persistence of lower savings rates, and consumer that is not particularly credit dependent (HERE). That is why employment has remained firm. Much higher employment is the main recession risk. Side note, the reasons R* might be higher are the same reasons why we have consistently pushed back on near-term recession risk and dire earnings forecast. In any event, the Laubach-Williams estimates of R* and G (HERE) appear too low. At least for now.
A simple way to think about the higher R* point, the Fed believes that monetary policy operates on aggregate demand, and thus inflation, through financial conditions and not just the level of the fed funds rate. We can reasonably assume that financial conditions have taken into account the current shape of the Fed funds futures curve (rates between 5%-4.5% between now and May 2026!!). And yet financial conditions have basically “normalized” back to post-GFC levels when the Fed funds rate was at or close to zero. It might prove over time that 1) fed funds have to go much higher to tighten fins conditions more or 2) 5% is restrictive and it will just take time to figure out. The first option seems more likely to us, but having conviction in ANY outcome is really hard. That is why we are fading extreme moves and narrative shifts and might have to eventually fade the higher R* idea.
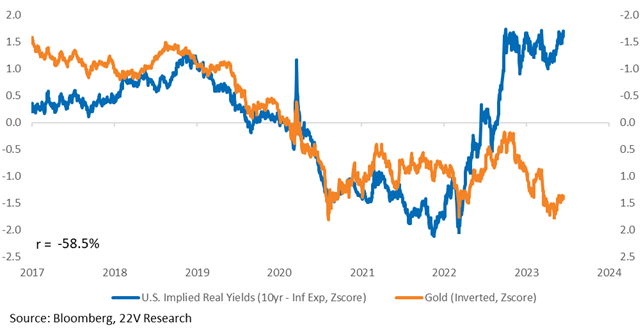
Side Note: If R* is higher and real rates need to be persistently higher just to keep the economy from overheating, that should be bad for Gold.