SUMMARY: We’ve been getting a lot of questions on hard vs soft data, and which data we follow to gauge recession risk, so we’ve got a slightly longer report today walking through it all. Hope it helps frame out recession risk…
SURVEY DATA DRAWBACKS: Survey data broadly has been recessionary. People frequently point to PMIs and to the senior loan officer opinion survey (SLOOS) to estimate elevated near-term recession risk. The problem with survey data is it is often NOT an indication of levels, as is the case for PMIs and the SLOOS. Most are a diffusion index, which measures change relative to the prior reference period, and are therefore susceptible to problems with different base effects.
For example, the Covid shock and recovery led to ultra-easy credit conditions, so the “level” from which tightening of credit conditions began was very easy. We can’t be sure about the level to which banks have tightened their lending standards based on the senior loan officer opinion survey (SLOOS), only that it is tighter than an extremely easy level following an unprecedented shock.
ESTIMATING RECESSION RISK: We consider recession risk almost entirely a function of the forward outlook for the Fed. As we mentioned yesterday, we do not think bank risk will cause a recession given C&I lending has held in and company financing sentiment is still strong (HERE). We also don’t put too much into the long and variable lags of monetary policy tightening. As Gerard wrote last week (HERE), Fed tightening flows into interest-rate sensitive sectors of the economy (housing, a little durable goods) and the drag there happened immediately looks like it is set to fade.
Going forward, the Fed is data dependent. Labor data in particular is important, because it feeds into the stubbornly strong service sector core inflation the Fed is focused on. So, we are paying closest attention to that.
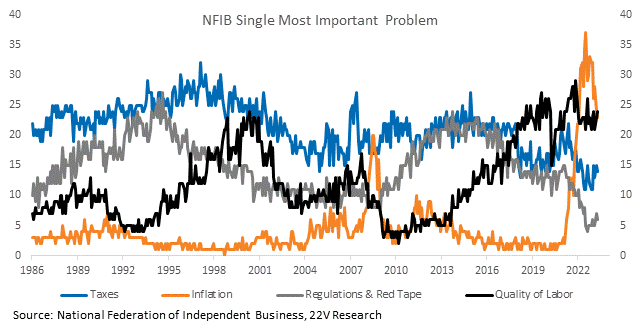
We think recession risk is farther out than consensus because, as our friend Angel Ubide, head of econ and macro at Citadel, explained in a webinar (HERE), there is inertia in the unemployment rate. Labor hoarding will take longer to unwind than investors anticipate. Companies are afraid they can’t find replacement talent (“quality of labor” is once again the largest concern for small businesses) so they will be reluctant to fire employees, especially since companies expect a better 2H23.
More details in the full report below…
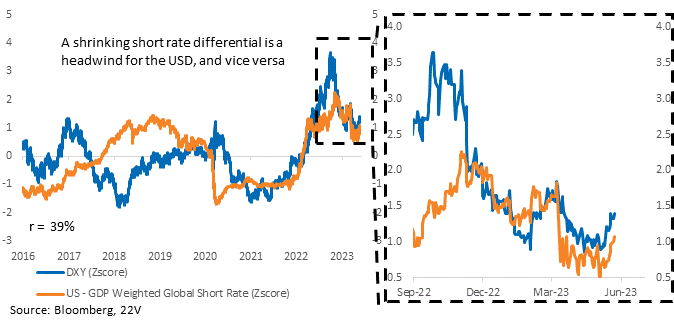
MARKET VIEWS: Overnight, Eurozone flash manufacturing PMIs broadly missed expectations while service PMIs continued to be much stronger than mfg. The data did not cause a meaningful change in ECB rate hike expectations. US short rates have risen more than ROW recently, helping explain some of the recent USD strength. Markets have priced in Eurozone service strength, and goods weakness in production economies like Germany’s are enough of an offset. Look to a reversal in the increase in US short rates and/or goods and services data beats in the eurozone to change the trend.
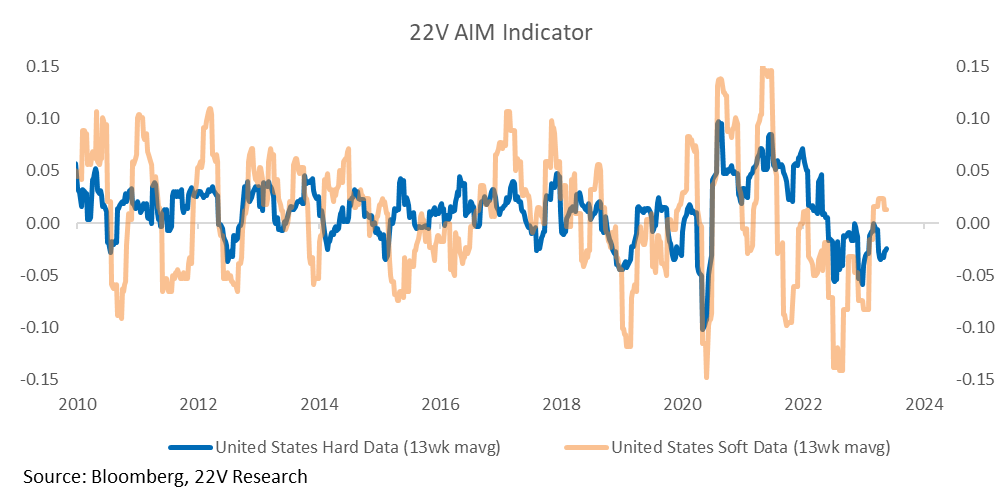
SURVEY DATA DRAWBACKS: Survey data broadly has been recessionary. People frequently point to PMIs and to the senior loan officer opinion survey (SLOOS) to estimate elevated near-term recession risk. The problem with survey data is it is often NOT an indication of levels, as is the case for PMIs and the SLOOS. Most are a diffusion index, which measures change relative to the prior reference period, and are therefore susceptible to problems with different base effects (details below). Hard data, which are actual levels, don’t always track soft data. Below we measure the breadth of hard data vs soft data, which illustrates how the two can diverge.
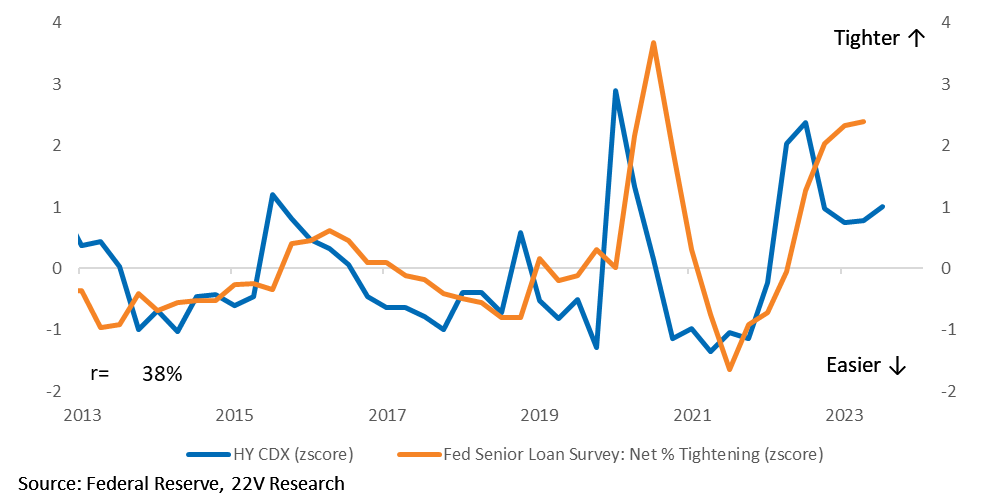
The SLOOS shows the net % of banks tightening lending standards has risen to its 98th percentile. Scary. However, the Covid shock and recovery led to ultra-easy credit conditions, so the “level” from which tightening of credit conditions began was very easy. We can’t be sure about the level to which banks have tightened their lending standards, only that it is tighter than an extremely easy level following an unprecedented shock. HY CDS do tend to track the survey, but have diverged recently. The credit market isn’t pricing the same recession risk. The impact from a significant economic shock cannot be ignored.
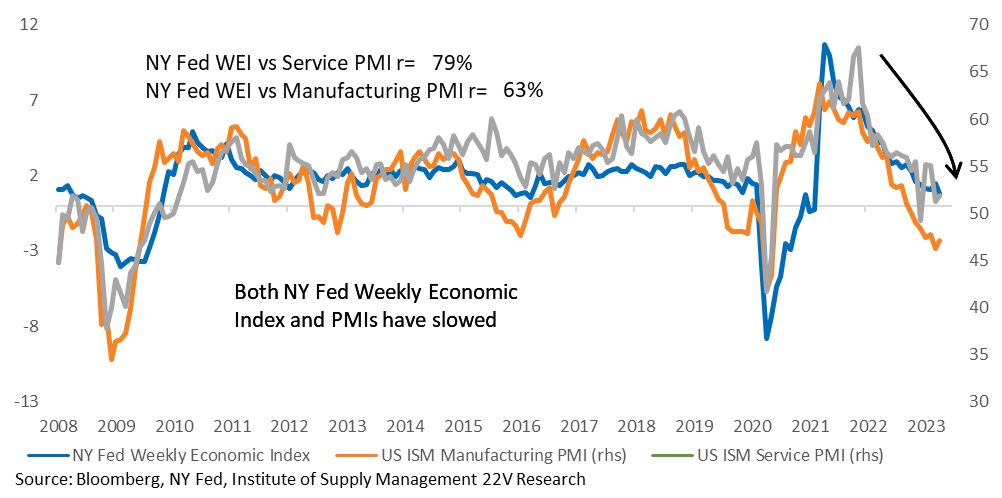
Production had to decline following the boom in goods demand from COVID. How many pelotons can we buy. That implies PMIs below 50, even if manufacturing is returning to a normal level. The NY Fed Weekly Economic Index (our preferred measure of underlying demand growth) has remained in a downtrend as growth has slowed. The manufacturing PMI is far below what level the WEI indicates. Gerard’s take on the industrial production data last week was that manufacturing is ok (HERE).
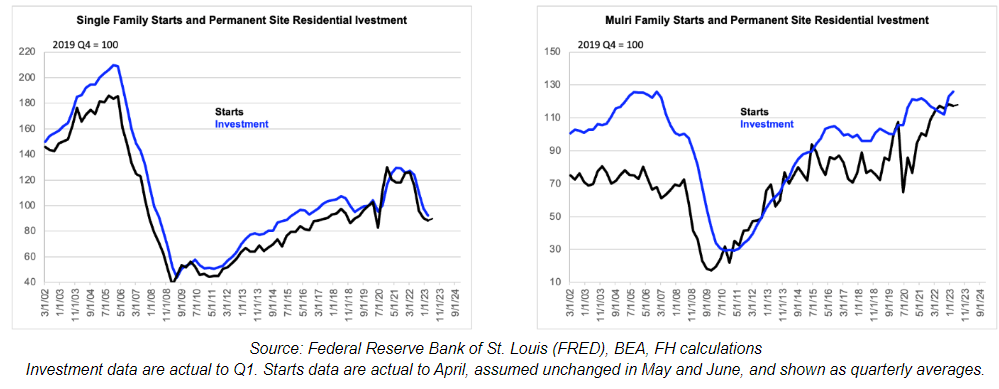
ESTIMATING RECESSION RISK: We consider recession risk almost entirely a function of the forward outlook for the Fed. As we mentioned yesterday, we do not think bank risk will cause a recession given C&I lending has held in and company financing sentiment is still strong (HERE). We also don’t put too much into the long and variable lags of monetary policy tightening. As Gerard wrote last week (HERE), Fed tightening flows into interest-rate sensitive sectors of the economy (housing, a little durable goods) and the drag there happened immediately looks like it is set to fade. Housing starts have already dropped.
Going forward, the Fed is data dependent. Labor data in particular is important, because it feeds into the stubbornly strong service sector core inflation the Fed is focused on. So, we are paying closest attention to that. Payrolls and the urate are the most important. Claims is the best higher frequency data. And although Powell references job openings a lot, we watch quits more, because actions are more informative than keeping a job posting up. The labor market needs to weaken. If it doesn’t the Fed will tighten again, and recession risk will increase.
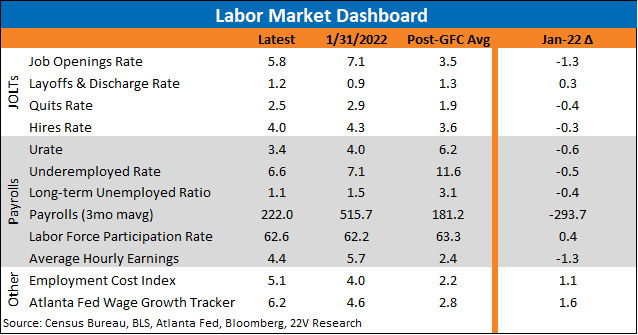
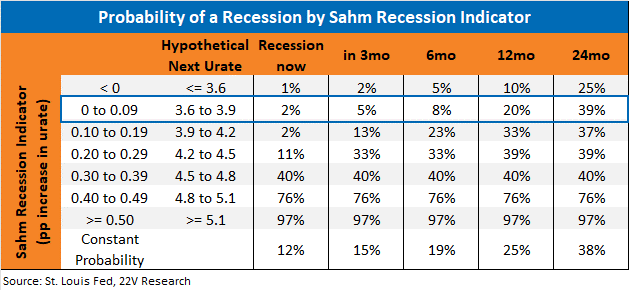
We can lean on existing work for estimating recession probabilities using labor data. When the urate rises, it tends to do so quickly, hence “rules” like the Sahm indicator or Goldman’s version, which signal a recession when the 3-month average urate rises +50bps off its 1-year low (+30bps for Goldman). The urate is still at its cycle low, leaving recession risk below normal. This is one of the reasons we have been consistently talking about near-term recession risk being below consensus estimates.

We know that the Fed will force the labor market to loosen, so longer-term recession risk is elevated above normal, unlike what the Sahm indicator would suggest if the economy were not in a tightening cycle. The Fed’s own forecast of the urate would breach the Sahm rule in September. The dots are outdated (March FOMC meeting) and not an accurate indicator anyway, but they do illustrate why we cannot rely on a rule like the Sahm indicator for longer-term recession probabilities.
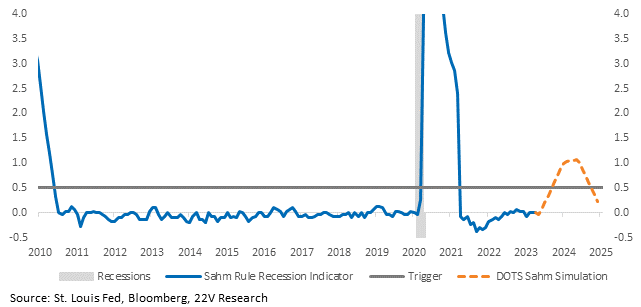
We don’t have recession risk as early in the year as the Fed dots would imply because, as our friend Angel Ubide, head of econ and macro at Citadel, explained in a webinar (HERE), there is inertia in the unemployment rate. Labor hoarding will take longer to unwind than investors anticipate. Companies are afraid they can’t find replacement talent (“quality of labor” is once again the largest concern for small businesses) so they will be reluctant to fire employees, especially since companies expect a better 2H23.