Weekly – For the last seven weeks we have pointed out that high-frequency data was relatively firm and did not support high near-term recession odds. That continued again last week. Two weeks ago we had relatively dovish core CPI data, Atlanta Fed wage growth tracker (unsmoothed) declined and a solid NY Fed weekly economic index (WEI) increased the soft landing odds.
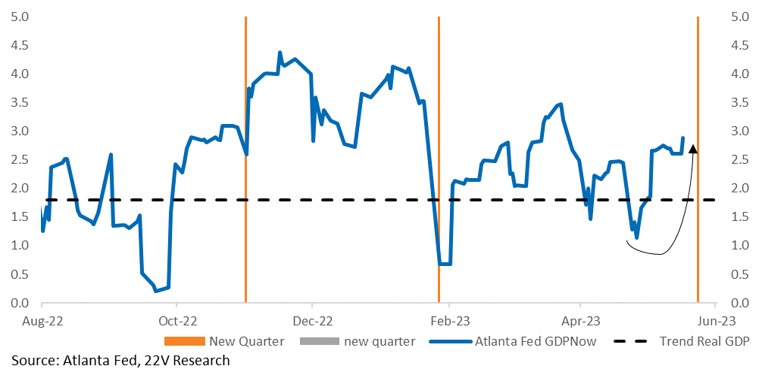
Odds of a soft landing, defined as the Fed easing without a growth accident occurring, rose because inflation indicators were less worrisome, but economic growth was solid. Last week’s retail sales, IP, housing, claims, and Philly Fed data beat expectations, reinforcing that near-term recession risk is low. After a firm 1Q GDP report, which was held back by inventories, the Atlanta Fed’s GDPNowcast for 2Q GDP growth increased to 2.9%. Lastly, high-frequency bank lending data and commentary from companies on liquidity and financing, which are more than fine, is reinforcing the idea that Mar/Apr was less bank run than bank walk (hat tip to Gerard HERE).
FYI On the Trend Economy Now: Underlying real Personal Consumption Expenditure (PCE) growth appears to be growing at about 1.5%. That is a downshift from 3% (which is hitting some retailers unusually hard) and we have no reason to believe real PCE growth will slow from this pace, based on income growth, wealth effects, credit availability, etc. Housing data is bottoming and manufacturing data is clearly getting less bad. Will inflation or wages come down enough given the current 1-2% underlying demand growth? That is still the major question.
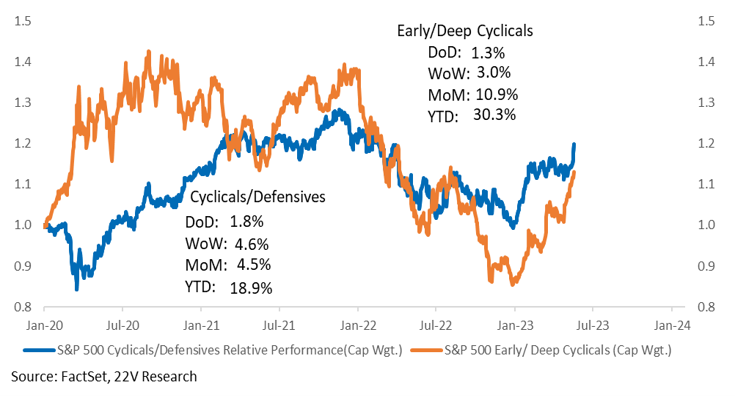
Recession Positioning Give Up: Sentiment has been unusually poor and positioning is still deeply negative. Last week that changed. Investors finally accepted that near-term recession risk is low (see our Survey results HERE), Cyclical sectors rallied relative to Defensives. The Low Vol names fell -3.9% while Earnings Turbulence gained 1.5%, and buyside EPS estimates for 2023 increased.
Our Call: We expect Cyclicals and Risk-on Factors will continue to outperform for multiple weeks, relative to Defensives. Deeper Cyclicals could outperform Early Cyclicals at the same time. Longer term, nothing has changed for us. It’s Early (Tech, Discretionary, Communications) over Deep Cyclicals (Energy, Industrials, Materials). Below is why.
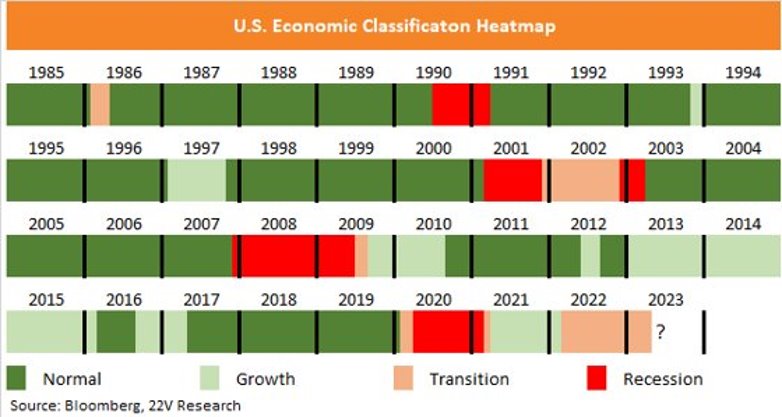
DON’T EXTRAPOLATE: 22V’s Quant work (HERE) has highlighted that we are in an economic transition period. Transitions are associated with conflicting economic signals. i.e., data suggest we could move into a recession or back to a normal economic backdrop. During Transitions mean reversion tends to be stronger. In early May, we highlighted (HERE) that our industry group mean reversion portfolio has been consistently outperforming (selling the previous month’s winners, buying the losers) and that would favor Cyclicals now. We didn’t suggest max-long cyclicals, but wanted to point out, again, the danger in extrapolating near-term economic narratives.
It’s a 50/50 call on recession 6+ month out our view. Until investors have a better understanding of how the economy will break, we will remain in a transition phase. That means the strength in Cyclicals and risk-on factors we are seeing now will likely reverse at some point.
Two Things That Will Anchor Growth Expectations (i.e. deep Cyclicals still face headwinds): 1) Direct measures of labor market tightness suggest employment growth has meaningfully overshot. The unemployment rate has fallen to its lowest level since 1969. That means the Fed needs to deliver a sustained period of below-trend demand growth to drive unemployment higher and reduce inflation pressures from the labor market. The Fed has paused, and Powell and incoming Vice Chair Jefferson reinforced that last week, but they are a LONG WAY from easing.
2) Given how strong the labor market is relative to demand growth, it seems evident the labor market will loosen more aggressively over the next few months. Many will assume that weakening employment means we are on a path toward bad economic outcomes. 10yr yields will eventually roll back over as a result. China is still a drag.
We would be wrong on deeper Cyclicals or risk-on factors in general stalling in the coming months if it becomes clear a 5% Fed funds is not restrictive enough. This is Jason Furman’s base case FYI. After all, savings rates were similar in and supported spending in 2006 with comparable interest rates. So, the labor market doesn’t cool enough, and with housing data already bottoming, PMIs would stabilize, given the inventory unwind in 1Q23 (HERE), econ growth could stay much firmer for longer and 10yr yields would increase significantly. With a Fed on hold, there COULD be a multi-month move in deeper Cyclicals.
On The Market: Fundamentally, S&P fair value remains in the 3,800-4,200 range, but that is dependent on assumptions (current and longer-term EPS growth, cash return, nominal yields). Our discipline for the past year has been to fade certainty and not extrapolate trends. We see no reason to abandon that approach, so we would use meaningful moves above 4,200 as an opportunity to sell UNLESS inflation trends ease significantly while growth remains steady. There is market upside under that scenario.
Charts below…
Indicators & Other Charts: Manufacturing readings have weakened, illustrated by the miss in the Empire manufacturing survey this week. But that weakness is largely survey-based rather than activity focused. As Gerard noted following the industrial production report (HERE), “harder data here do not look alarming by historical standards. The economy has taken this particular hit and dynamics internal to the manufacturing sector itself do not look very threatening.” People are worried about the economy but are not acting in a way consistent with a rapid slowdown.
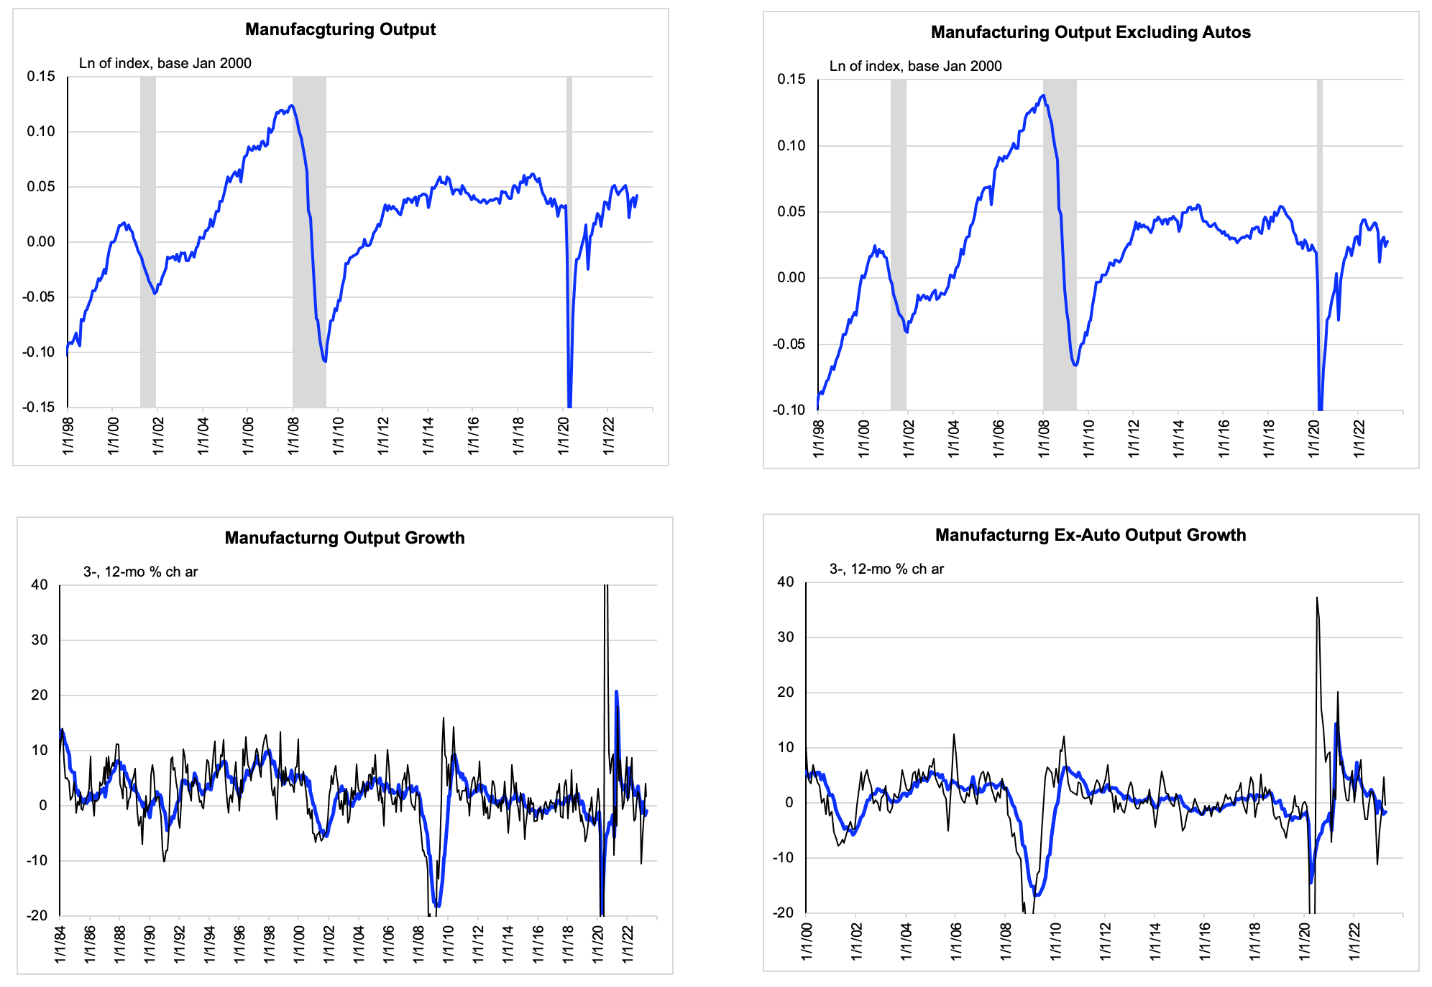
Data are actual to April.
Retail sales beat expectations. From Gerard, “The more relevant point is that underlying real PCE growth appears — just eyeballing the historical data, with no overlay of priors — to be growing at about 1 1/2%… The Fed would probably be content with a growth rate near there, assuming a slight collective drag from other components of GDP.” How consumer spending evolves will remain critical for setting soft vs. hard landing odds, but trends so far suggest a slow decline in consumption and inflation.
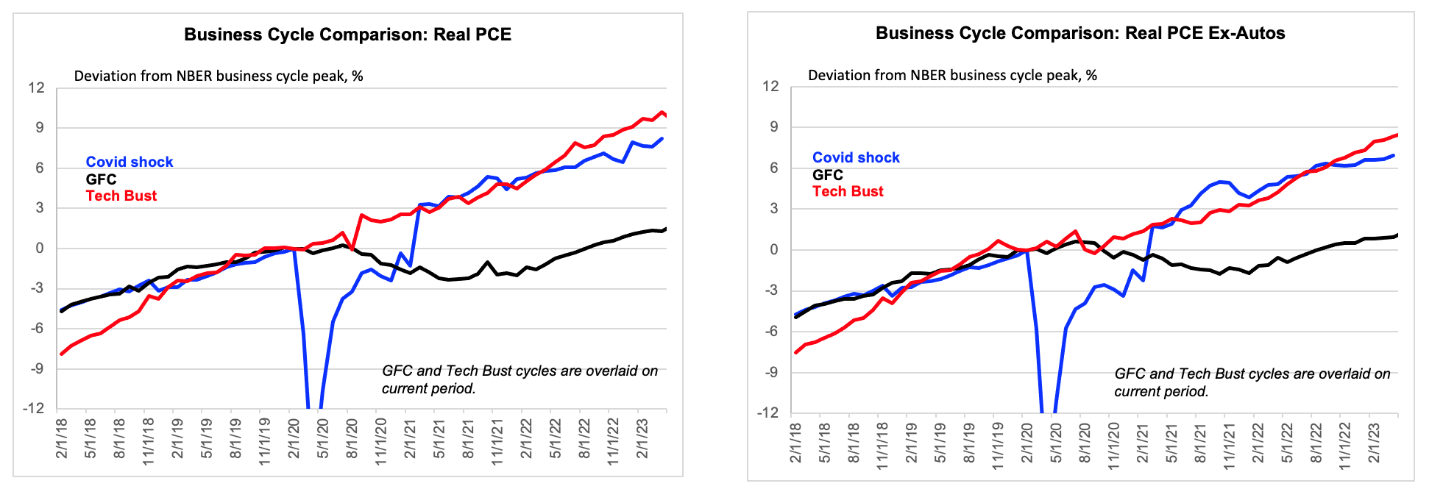
Data are actual to March and estimated to April.
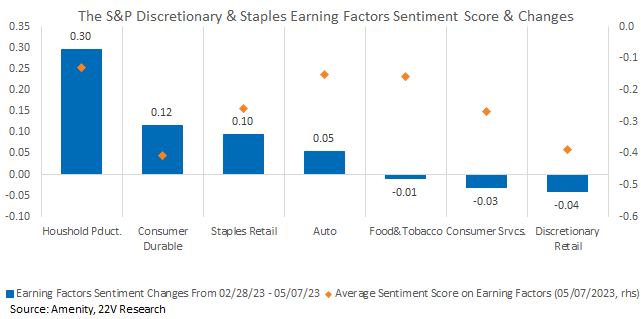
Earnings sentiment, measured with the Amenity natural language processing tool, suggests Household products, Durables, Staples, and Auto earnings will remain ok, faring better than Consumer Services and Retail. Part of correlations breaking down are divergences WITHIN as well as between groups. Separating relative winners within consumer groups (Staples and Discretionary) is important and fits with our lower correlations call. Discretionary Retail still has problems.
Fundamentally, S&P fair value remains in the 3,800-4,200 range, but that is dependent on assumptions (current and longer-term EPS growth, cash return, nominal yields). Mechanically, positioning is still deeply negative. Short-term, the mechanical will overwhelm the fundamental IF investors price in high(er) soft landing odds. There is also the odd dynamic (historically) of low CFTC net S&P futures positioning but expensive hedging.
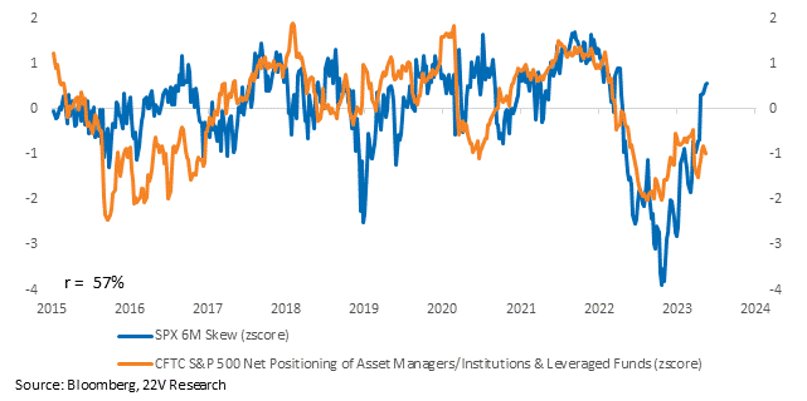
Strong wealth effects and income growth continue to support spending. Also, after a firm 1Q GDP report, which was held back by inventories, the Atlanta Fed’s GDPNow is forecasting 2.9% GDP growth in 2Q. A sharp tightening in lending standards is not hitting the economy for now.
Last month Defensive industry groups significantly outperformed Cyclical industry groups as recession worries increased. In early May we highlighted (HERE) that our industry group mean reversion portfolio has been consistently outperforming (selling the previous month’s winners and buying the losers). We didn’t suggest max-long cyclicals, but wanted to point out, again, the danger in extrapolating near-term economic narratives.
22V’s Quant work (HERE) has highlighted that we are in an economic transition period. Transitions are associated with conflicting economic signals. i.e., the data suggest we could move into a recession or back to a normal economic growth backdrop. During Transitions mean reversion tends to be stronger and extrapolation fails. Also, risk-off factors, which have posted extreme gains since the bank failures, generally struggle outside of Transition/Recession periods. The bottom line is lower hard landing odds make the medium-term outlook for Low Vol stocks less attractive, while stocks with strong fundamental momentum are more attractive (Value too, but that is a harder call today, HERE).
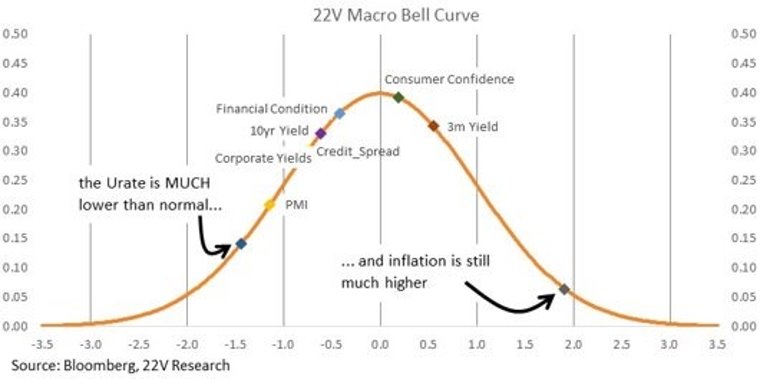
Readings on the Urate remain extremely low and inflation too high, encouraging tight central bank policy. That will keep medium-term recession odds elevated, which leads to ongoing factor volatility, particularly in risk-on/off factors. The labor market is still likely to loosen, so expect another round of Defensive performance over the coming months.
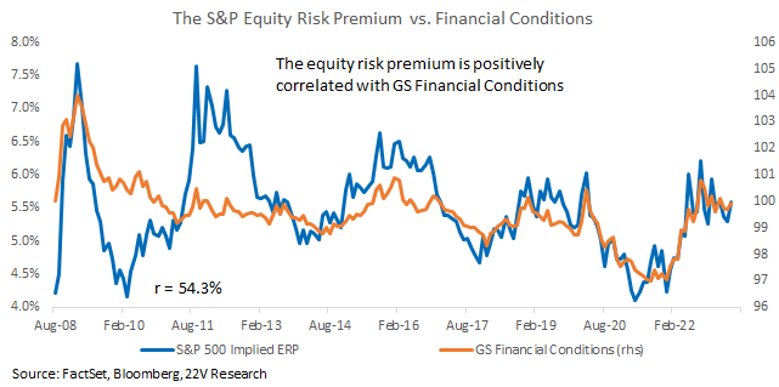
The Fed is on hold for now though, which means FCI shouldn’t move much and that will keep PEs range bound. But an aggressive FCI easing is unlikely. Fundamentally, S&P fair value remains in the 3,800-4,200 range, but that is dependent on assumptions (current and longer-term EPS growth, cash return, nominal yields). Our discipline for the past year has been to fade certainty and not extrapolate trends. We see no reason to abandon that approach, so we would use meaningful moves above 4,200 as an opportunity to sell UNLESS inflation trends ease significantly while growth remains steady. The market has upside in that scenario.
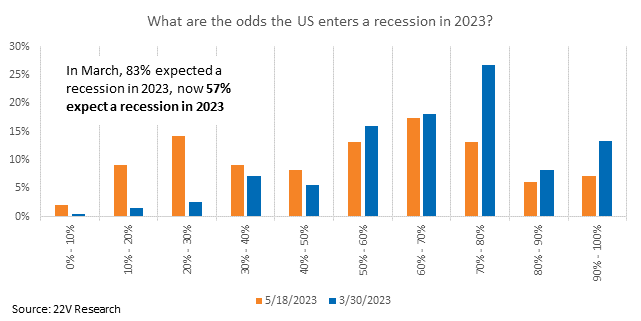
Sentiment & EPS: According to our Surveys (HERE), investors had been expecting a recession this year, with between 75%-90% of our respondents putting the odds of a recession in 2023 consistently above 50%. That has changed. Now, just 57% expect a recession in 2023.
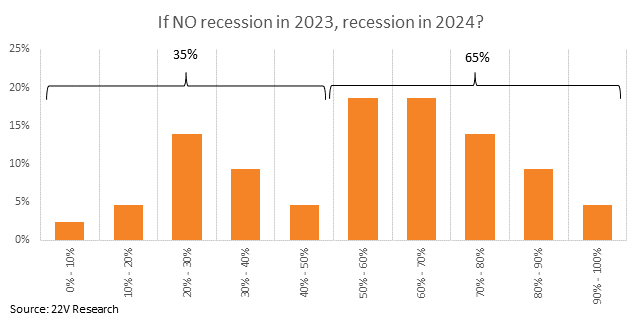
It is May, so the odds of a recession in 2023 should be lower as a function of the calendar, but investors who do not expect a recession in 2023 don’t necessarily expect a recession in 2024 either. In other words, there is a new cohort of investors (31% of respondents) who do not expect a recession at all. 65% of investors still expect a recession in 2024 though.
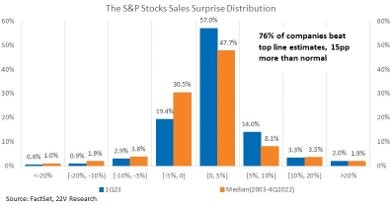
If a recession is avoided this year, expect S&P company sales growth to continue to beat expectations. 76% of companies beat on the top line, 15pp more than usual and consistent with still firm nominal activity. Margins are still a headwind, so don’t expect significant EPS upside, but the earnings outlook is much improved from late-‘22/early-’23 as recession odds have come down.
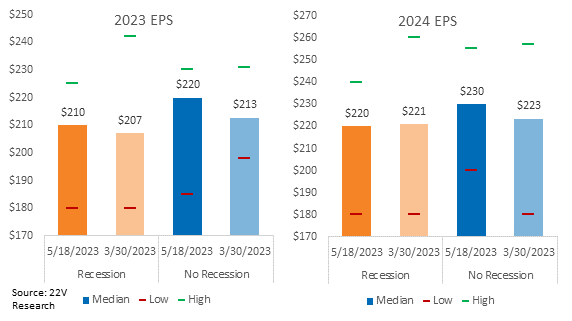
22V’s Survey data shows investors who do not expect a recession have raised their EPS expectations $7 for 2023 and $10 for 2024. The change in estimates is more moderate for those expecting a recession, with a $3 increase for 2023 and -$1 decrease for 2024. Investors should expect $220 to be the new consensus for 2023 S&P earnings if recession risk continues to decline.
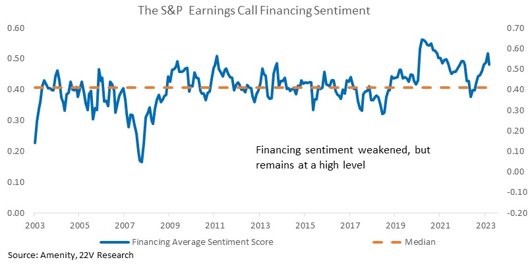
Two Important Liquidity Tracking Tools: Using the Amenity Natural Language Processing tool we can track management sentiment toward Financing (availability of cash and credit). It declined in 1Q but didn’t collapse. That confirms broader data about bank and corporate credit availability. Things have tightened at the margin but are far from tight. Financing sentiment would need to track the Senior Loan Officer Opinion Survey (SLOOS) lower to get comfortable the LEVEL of the SLOOS data, not the change, is an issue for the economy.
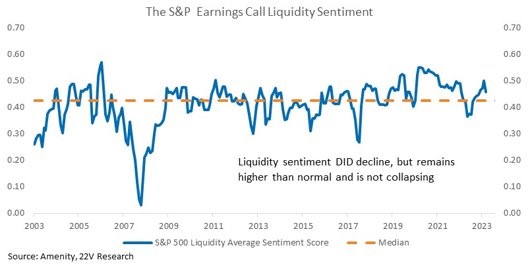
Drilling down a layer, management sentiment toward liquidity (availability of cash) also 1) moved lower and 2) remains high. There are few signs of cash flow or credit issues coming out of the 2Q earnings data. The same analysis run on the Financials space shows similar trends. Financing and Liquidity availability fell in 1Q, but the feared/expected collapse did not occur.
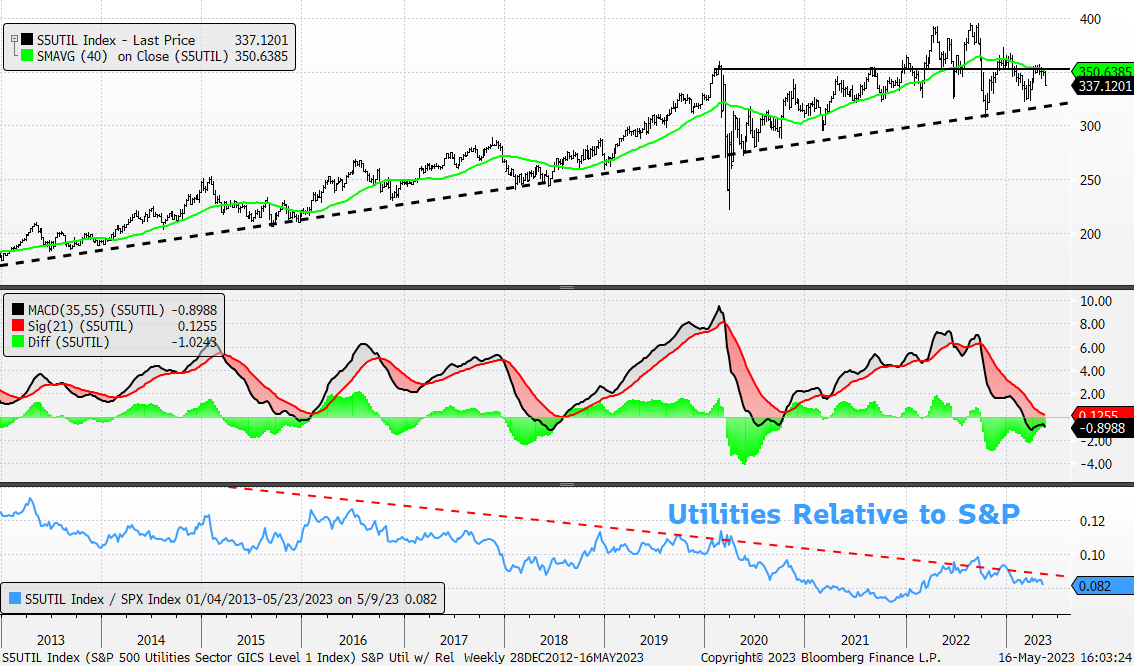
John Roque Had Some Charts on Utilities and HC. Wanted to Pass Along – S&P Utility Sector: Weekly w/ 40-Wk MA, MACD, and Rel to S&P: Negatives include a Technical Score = 0, below downward-sloping 40-Wk MA, negative weekly mo, and bearish vs. S&P. (You can substitute the Utilities Select Sector SPDR Fund for the S5UTIL below)
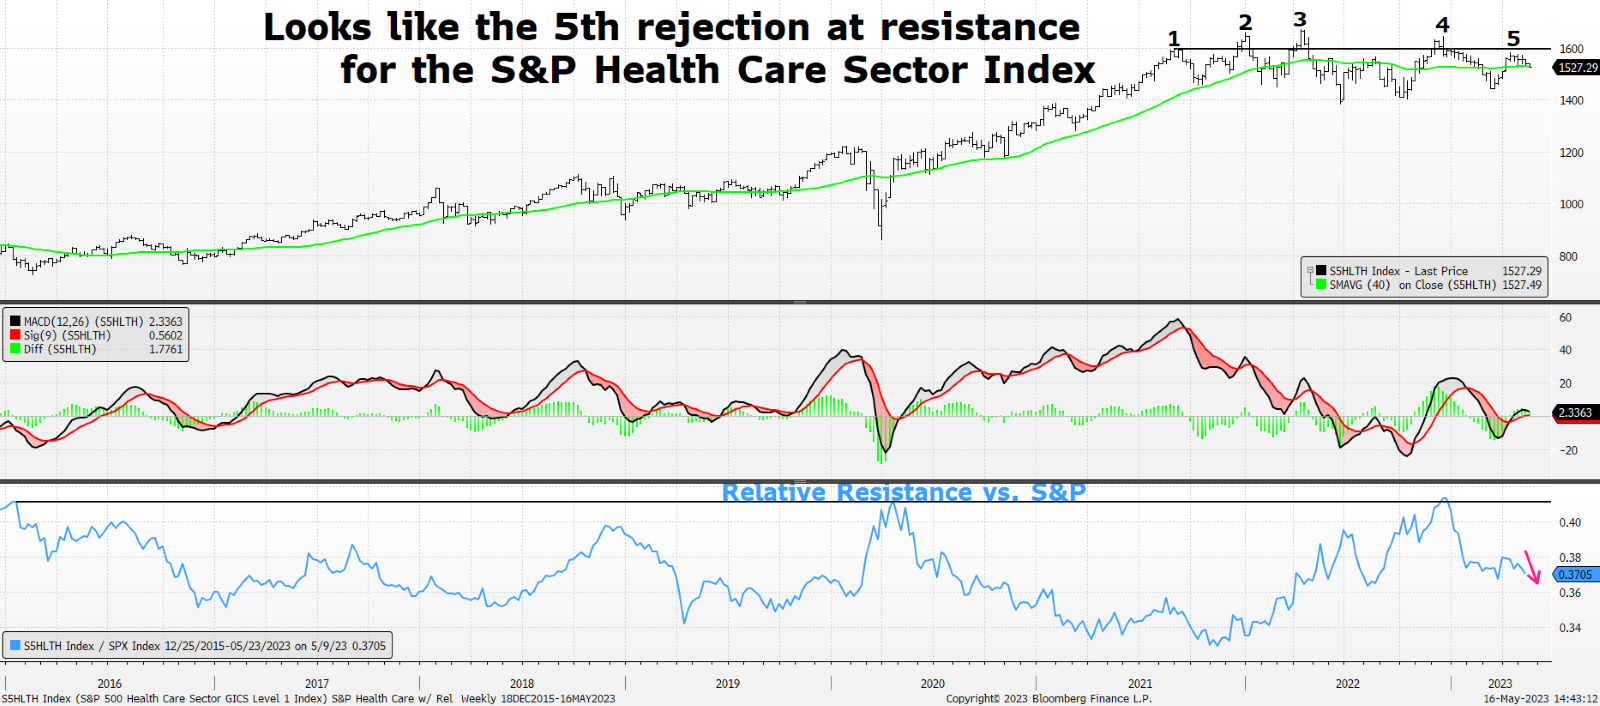
S&P Health Care Sector Index (S5HLTH) and the comparable ETF is the XLV: Rejected for the 5th time at resistance. Close to moving below its cresting 40-Week Moving Average. Punky momentum. Weakening, again, relative strength vs. S&P 500.