SUMMARY
- Strong headline numbers, flattered by a base effect from Shanghai’s lockdown last year, mask slowing momentum in China’s economic activity in April; private investment and property activity were particularly weak, while services and consumption remained relative bright spots.
- The weak data release makes it all but certain that Beijing will step up infrastructure stimulus but likely not until Q3; China’s leadership remains intent to maintain overall financial discipline, making broad easing measures unlikely.
- Growth will continue to be led by services rather than industrial activity, which means relatively fewer positive spillovers from China’s recovery to global demand, particularly for hard commodities.
Adjusting for the base effect from April 2022, when Shanghai went into lockdown, China’s economic activity last month look very poor – much worse than consensus forecasts. Despite some eye-popping year-over-year figures, April indicators show a faltering recovery beset by weak demand, particularly in terms of private investment activity and the property sector. The areas of relative strength remain services activity and household consumption, with the latter tilted towards spending on services rather than big-ticket goods purchases. Below is our initial take on the data as well as the policy response.
Policy Outlook: Targeted easing for now, additional infrastructure spending in Q3
We had expected a middling data release (see our preview note HERE) but one that would not be so bad as to force China’s leadership to announce new stimulus measures in the near-term. We have argued that Beijing would instead wait until close to the end-July Politburo meeting on the economy to roll out additional infrastructure spending to carry growth in the second half.
The April numbers make that Q3 stimulus all but certain but probably do not move up the timing. Despite the big miss against expectations and multiple signs of slowing momentum, Beijing will aim to maintain overall financial discipline and keep bullets in reserve for H2.
What form will stimulus take? Houze Song of Macro Polo (the think tank of the Paulson Institute), whose insights have informed our take on the 2023 outlook (see our collaborative piece from January HERE) takes the view that Q3 stimulus will focus on accelerating existing infrastructure investment plans, prioritizing construction-intensive projects but not announcing a new slate of major projects. This will be financed by local government bonds, policy banks, and commercial bank loans.
That take seems right to us. The investment package will be relatively modest in scale given Beijing’s concern over the debt burdens of local governments, who are responsible for most infrastructure spending. We would caution against overstating Xi Jinping’s urgency to boost short-term growth; he remains more focused on longer-term goals, including advancing industrial policy, and avoiding systemic financial risks. Growth that meets the conservative target of “about 5%” and maintains basic stability is good enough for Xi this year.
Low inflation provides some scope for PBOC to loosen monetary policy, and a modest cut to the benchmark loan prime rate is possible over the next quarter. But the main problem for the economy is not high rates but a lack of demand for capital by firms and households. PBOC will thus focus less on rate cuts and RRR cuts than on providing sufficient liquidity and quantity of credit to support the infrastructure program, and targeted measures to lower deposit costs for banks (which in turn encourages lending while discouraging household saving).
That said, it will be important to watch the monetary policy response amid an evolving debate about whether China’s faces the risk of entrenched deflation. That looks to be a premature conclusion – disinflation yes, deflation no – but it is attracting enough attention that PBOC as well as the statistical bureau have gone out of their way in recent days to brush back on these concerns. One reason such fears have gained currency is China’s worsening demographics and property downturn, both of which lead to inevitable comparisons to Japan’s experience since the 1990s.
We will have more to say on the stimulus outlook as Q3 draws closer and the policy conversation evolves.
April data: Industrial activity was anemic
Industrial production grew 5.6% y/y in April, a wide miss compared to the Bloomberg survey of 10% y/y. While headline growth was a bit faster than the 3.9% y/y rate in March, that is heavily distorted by the base effect from Shanghai’s lockdown last year. On a month-over-month basis, industrial production slowed by -0.47%, its first sequential decline since November. The service production index was up 13.5 y/y in April, compared to 9.2% y/y in March, but the base effects here are also misleading.
Another way to put the data in context is to look at the two-year compound annual growth rate (CAGR) – that is, calculating growth between April 2021 and April 2023 to smooth out last April’s base effect. The two-year CAGR for industrial production slowed from 4.4% in March to only 1.3% in April, while the two-year CAGR for the service production index slowed more modestly, from 4% in March to 3.2% in April.
Relative to the pre-pandemic trend, neither services nor industrial activity are going gangbusters. But services activity is getting a pop from the lifting of Covid restrictions, while industrial activity is suffering from a lack of end-demand given slowing exports, weak domestic investment, and modest household spending on goods. That pattern of growth means fewer positive spillovers from China to the rest of the world, particularly hard commodities, given that services are less import- and commodity-intensive than industry.
Fixed asset investment slowed and remained dependent on stimulus
Fixed asset investment (FAI) slowed from 5.1% y/y year-to-date in March to only 4.7% y/y ytd in April – the slowest rate since late 2020. On a sequential basis, FAI slowed for the second straight month.
By composition, FAI remained highly dependent on infrastructure spending, which held steady at 8.5% y/y ytd in April compared to 8.8% y/y ytd in March. Manufacturing slowed to 6.4% y/y ytd (from 7% in March). China’s National Bureau of Statistics has not yet released the figure for property FAI, but it likely worsened from -5.1% y/y ytd in March (see next section).
Another way to show the reliance on stimulus is to note the weakness in private investment, which we had flagged as a key watchpoint in our preview note. Private investment FAI grew by only 0.4% y/y ytd in April (down from 0.6% y/y ytd in April), compared to 9.4% y/y ytd for state-owned firms (10% y/y ytd in March). This divergence is a vulnerability given that there are limits to how much Beijing will continue to lean on state firms to invest amid concerns over their debt burdens.

The property rebound slipped back as households deleveraged
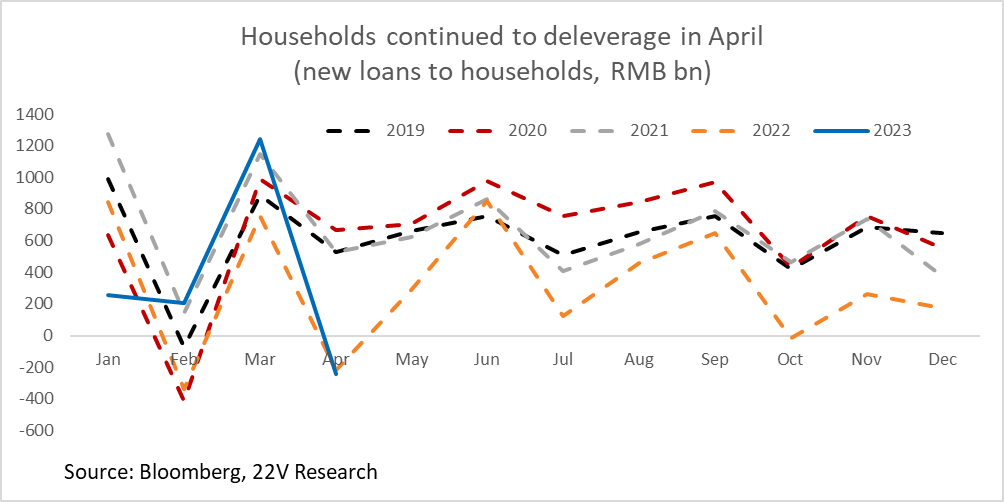
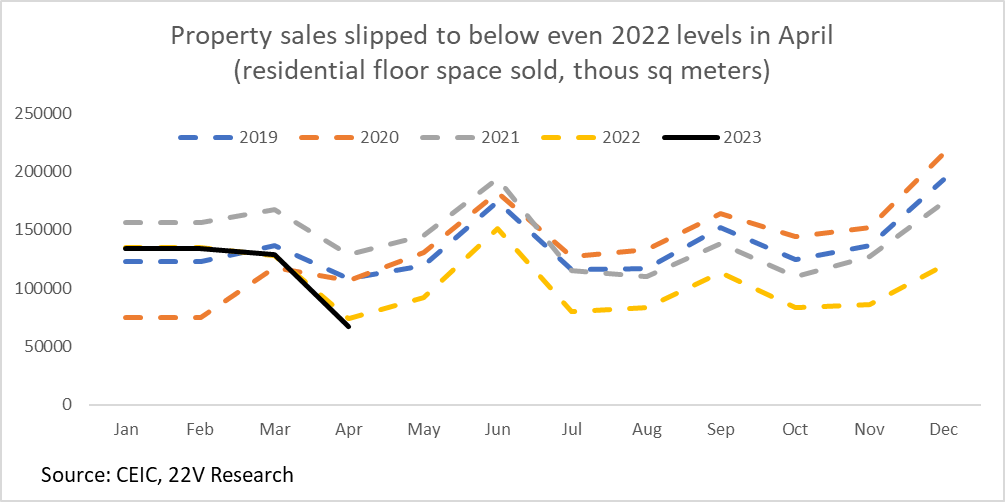
A plunge in new household lending in April was an early warning that property sales were likely to lag. That was indeed the case, with residential floor space sold slipping below 2022 levels in April (chart below). Households remain cautious about the broad economic outlook and the property sector, while demographic headwinds (declining population, slowing urbanization) eat away at real demand for new housing.
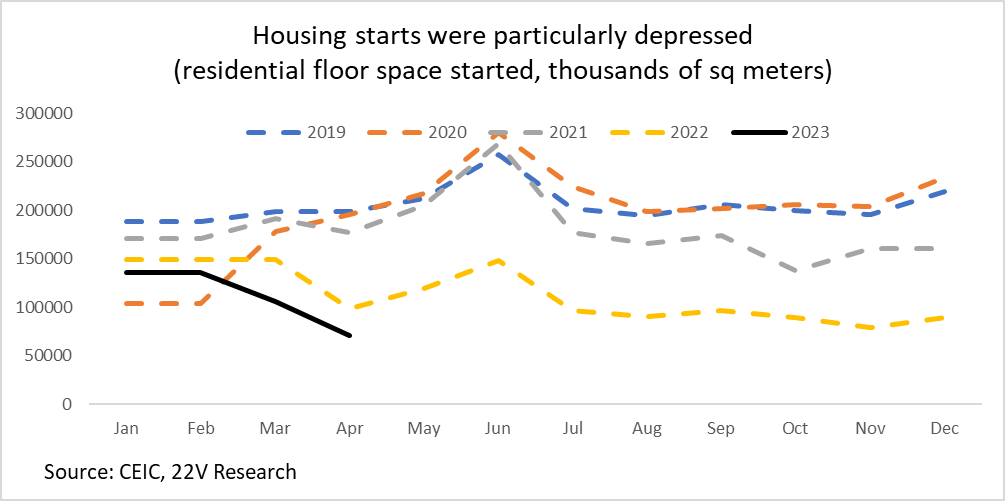
Housing starts remained particularly depressed. Property developers are using sales proceeds to complete stalled projects (under pressure from the government) and to pay maturing debt rather than begin new projects. This limits new construction activity as well as land sales revenues from local governments, which is important for funding infrastructure spending.
There is relatively little that Beijing can do to spur property demand at reasonable cost to the government and without worsening debt risks or backtracking on Xi’s commitment to move to a new model for the sector. The path to recovery for property will remain long, forcing Beijing to periodically step in to stabilize overall demand with infrastructure and other stimulus measures.
Retail sales were a relative bright spot
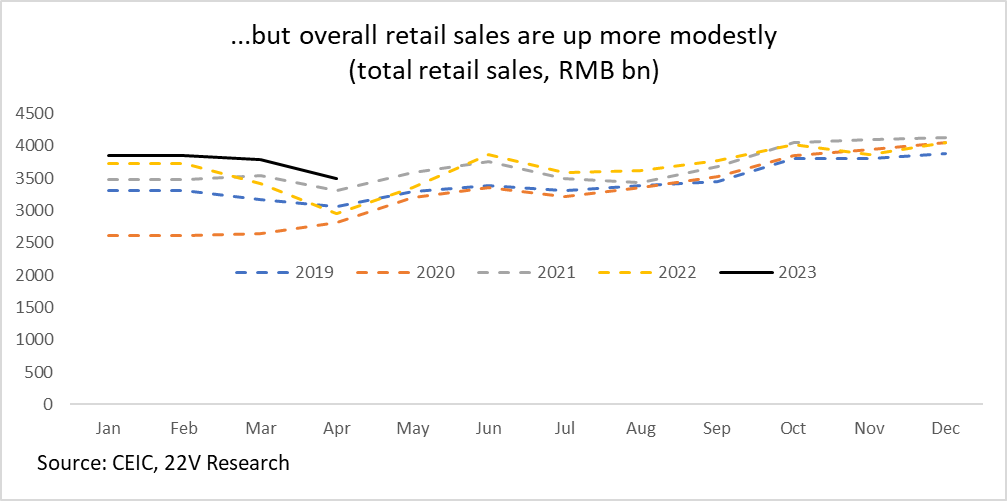
The retail sales data were less of a disappointment than other series, growing 18.4% y/y in April (up from 10.6% y/y in March) compared to the survey expectations of 21.9% y/y. Again, one needs to put those headline numbers into context. On a sequential basis, retail sales slowed to 6% (m/m saar), from 10% in March. The two-year CAGR for retail sales slowed to 2.6% in April, from 3.3% in March. Note that retail sales in China also include spending by firms and local governments, so are an imperfect barometer of household consumption.
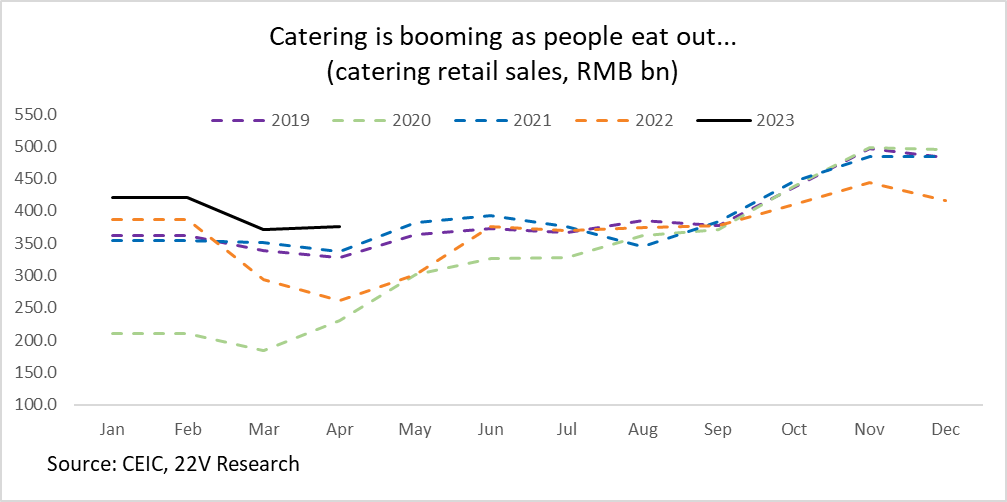
Households are more willing to open their wallets on services than on goods, seen in strong retail catering sales (chart below), a proxy for dining out. The two-year CAGR for catering sales improved to 5.4% in April, from 2.8% in March, while goods purchases slowed to 2.3% in April (two-year CAGR) from 3.3% in March. Big-ticket mass market goods purchases such as appliances (-2.1% two-year CAGR) and autos (-0.9%) remain subdued.
To the extent that China is seeing modest “revenge spending” it is on luxury items such as gold and jewelry (2% for the two-year CAGR). Spending by wealthy households is less impacted by the headwinds facing broader consumption – below-trend income growth and weak consumer confidence. The overall consumption rebound will remain gradual, requiring gains in employment and household income growth in coming quarters, given Beijing’s reluctance to provide direct fiscal support to households.
While the surveyed unemployment rate fell by 0.1 ppts to 5.2%, youth unemployment reached a new peak of 20.4%. That is as much a structural problem as a cyclical one. Although employment remains a top concern of economic policymakers, including Premier Li Qiang, they continue to focus on structural and direct administrative solutions (including effectively ordering SOEs to hire recent graduates) rather than leaning on broad-based stimulus to try to absorb jobs.