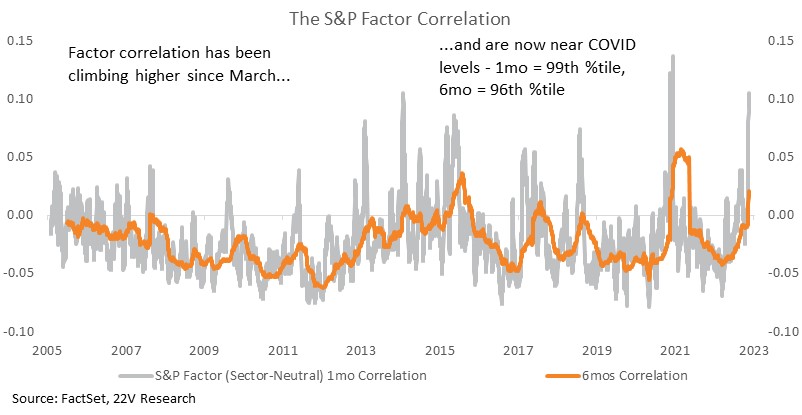
Stock return correlations have started dropping from their cycle high as we expected (details HERE), while factor return correlations continued to climb, furthering the trend that started earlier this year. Recently both short and longer-term correlations have shot higher, reaching extreme levels (99th and 96th %tiles, respectively). Though there have been some large divergences between specific factors influenced by changes in financial conditions, overall factor returns are moving more together now. That has made outperformance though factor selection more difficult, but also makes the potential breakdown in correlations more profitable.
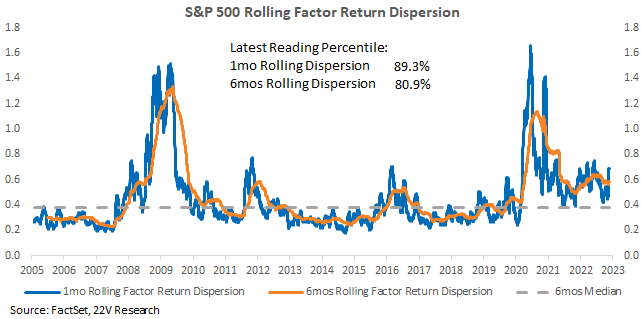
Long term factor dispersion has trended lower as well on declining macro uncertainty, and falling equity, bond and currency volatility. Factor returns have been most volatile between Value vs. Growth, and Earnings Turbulence vs. Low Volatility, so those are the pairs we focused on in this report.

The rank correlation (similarity of factor scores) between Realized Value and Realized Growth turned slightly positive at their peak. Returns of Earnings Turbulence and Low Vol factor groups have been volatile this year, following trends in financial conditions but rank correlation between those factors remains negative.
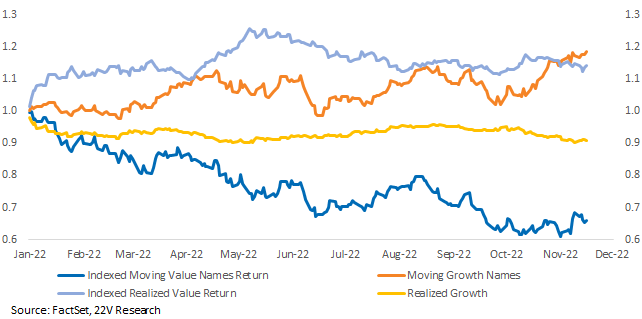
We filtered for names that become MORE Realized Growth and less Realized Value (Moving to Growth basket). These are stocks that became “growthier” as the year progressed. We also create a Moving to Value basket. Stocks that became more Growth significantly outperformed stable Growth ranked stocks and kept pace with steady Value names. As the overall market has been more multiple driven this year (details HERE), names rotating into Value are more likely to be driven by price declines, explaining their sharp underperformance YTD.
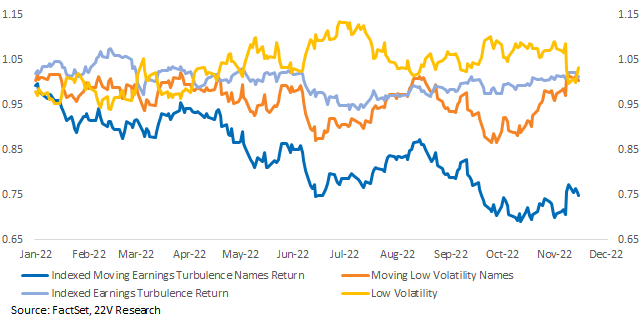
We constructed a similar set of baskets for Turbulence and Low Vol names and the conclusions were similar. Investors have shunned stocks with increased fundamental volatility and favored stocks with stable earnings and price risk.
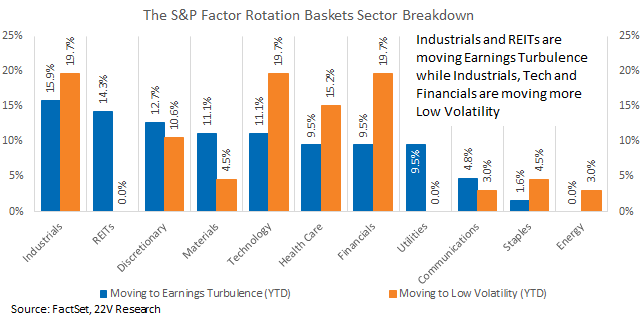
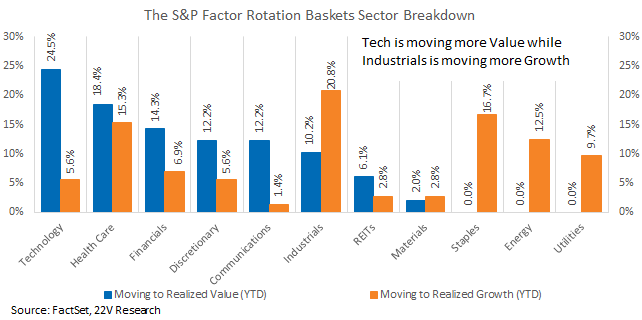
We also look at the sector breakdowns (Tech had become MUCH more Value, Industrials and RETIS have become more Turbulent). Looking ahead to the end of the year and 1Q23, given investors expect stocks to retest their lows at some point in the first quarter, focusing on stocks avoiding stocks with lower earnings uncertainty and Growth characteristics makes sense.
Breaking Down Changes in Rank Correlations: Stock return correlations have started dropping from their cycle high as we expected (details HERE), while factor return correlations continued to climb, furthering the trend that started earlier this year. Recently both short and longer-term correlations have shot higher, reaching extreme levels (99th and 96th %tiles, respectively). Though there have been some large divergences between specific factors influenced by changes in financial conditions, overall factor returns are moving more together now. That has made outperformance though factor selection more difficult, but also makes the potential breakdown in correlations more profitable.
Even as overall factor correlations have increased, long-term factor dispersion has been trending lower, consistent with the declined in equity, bond, and currency volatility. Factor return leadership has been rotating between Value and Growth, and Earnings Turbulence and Low Volatility. We focus on the correlations and rotations within those pairs in the rest of the report.
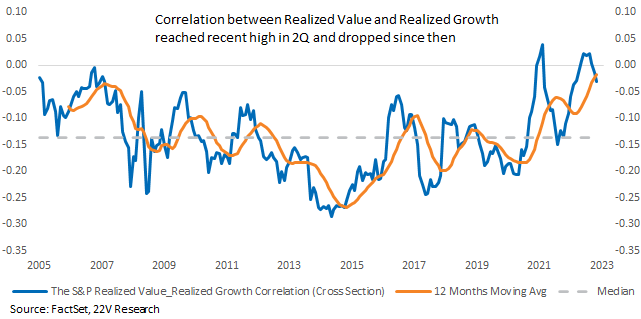
Value vs. Growth Correlations: The rank correlation (similarity of factor scores) between Realized Value and Realized Growth has been climbing since mid-‘21 and reached a relative high in 2Q. Score correlations between Value and Growth turned slightly positive at their peak. Initially, as those rank correlations increased, it was unclear how Value would act relative to Growth. Today, reduced macro uncertainty creates the backdrop for those negative relationships to normalize, but that is complicated by the multiple driven nature of equity market moves.
We filter out names that have become MORE Realized Growth and less Realized Value since the beginning of the year as a Moving to Growth basket. These are stocks that became “growthier” as the year progressed. We also create a Moving to Value basket. Stocks that are more Value today were driven by underperformance as those names declined more rapidly than stable Value names. Stocks that became more Growth significantly outperformed stable Growth ranked stocks and kept pace with steady Value names. As the overall market has been more multiple driven this year (details HERE), names rotating into Value are more likely to be driven by price declines, explaining the sharp underperformance YTD. Names moving toward Growth tend to be more fundamentally driven.
The Value rotating basket consists mostly of Technology and Health Care names, including some mega cap names such as GOOG and META. Both sectors have underperformed the S&P this year. Industrials and Staples names have become Growthier and both outperformed this year. Sector breakdowns confirm the reasons for Value and Growth rotations. If the market retests its low in 1Q23 as most investors expect (survey result HERE), rank correlations between Value and Growth should remain relative high near.
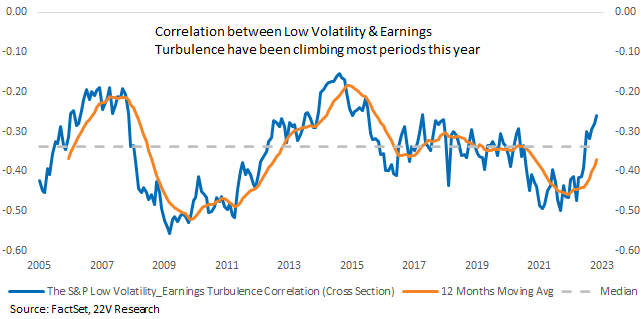
Earnings Turbulence vs. Low Volatility Correlation: Returns of Earnings Turbulence and Low Vol factor groups have been volatile this year, following trends in financial conditions and worries about a possible deep recession. The rank correlation between Turbulence and Low Vol has also climbed higher this year but remains negative. That suggests higher fundamental (earnings) volatility continues to lead higher stock return volatility, though at a lower extent.
Filtering moving Earnings Turbulence and Low Volatility names since the beginning of the year the same way as moving Value/Growth baskets shows a similar pattern. Moving to Earnings Turbulence basket underperformed most while Moving to Low Volatility names underperformed stable Low Volatility names. Investors have punished stocks that have increasing fundamental uncertainty, favoring names with stable risk.
More stocks within Industrials and REITs are moving towards Earnings Turbulence relative to the beginning of the year, while Industrials, Tech and Financial names have moved to Low Volatility. None of the REITs are less Low Volatility exposed, suggesting broadly increasing risk (price and fundamental) within REITs, in line with its underperformance. Industrials names have the greatest overall divergence.