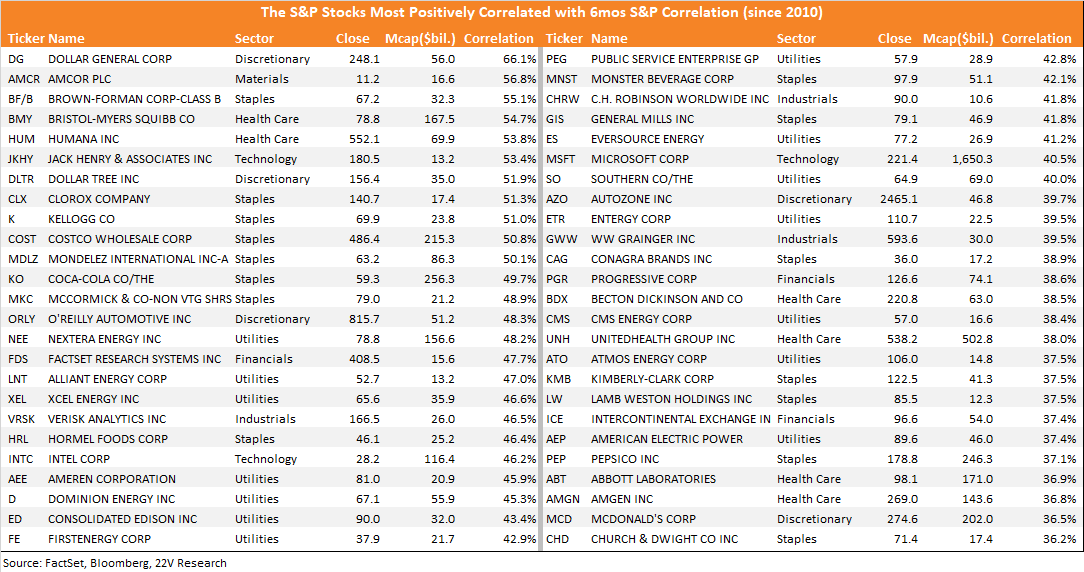
S&P correlation (measured using IPC) has begun moving lower on both a short and long-term basis over the past few weeks as we expected (report HERE). That trend is likely to continue as marginally lower economic uncertainty (reduce tail risk) encourages equity, bond, and currency volatility to move lower. IPC remains extreme, with 1 and 6mo S&P IPC at its 87th and 93rd %tiles respectively. Those readings should trend lower as macro uncertainty declines.
As 6mos correlation has rolled over, EPS Momentum, Realized Profitability and, Earnings Turbulence have been the leading factors, consistent with historical trends during periods of declining IPS. Both Realized Growth AND Realized Value have slid lower over the same period though, which is unusual. Realized Value returns have been very volatile over the past few weeks. With rank correlations between Value and Growth still unusually strong (near zero, normally they are negative), and NTM PEs of Value VERY high relative to Growth, expect ongoing volatility between those groups.
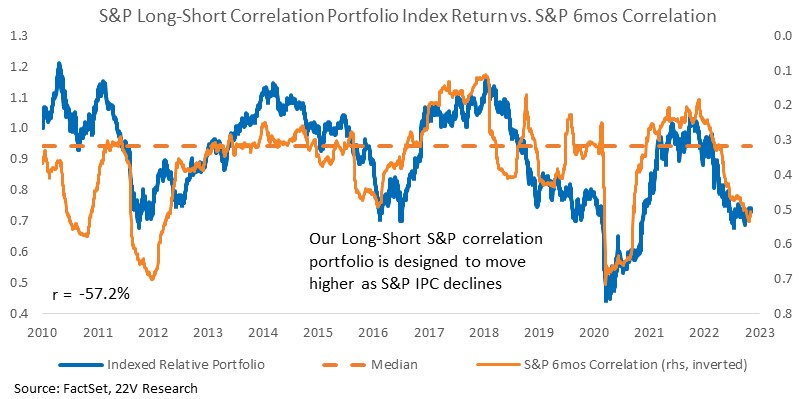
As S&P IPC continues to decline, the stocks most negatively correlated with it should benefit from the change at the expense of the names most positively correlated. This research series is designed to track how well stocks with negative relationships to changes in S&P correlation perform over the coming months as IPC mean reverts.

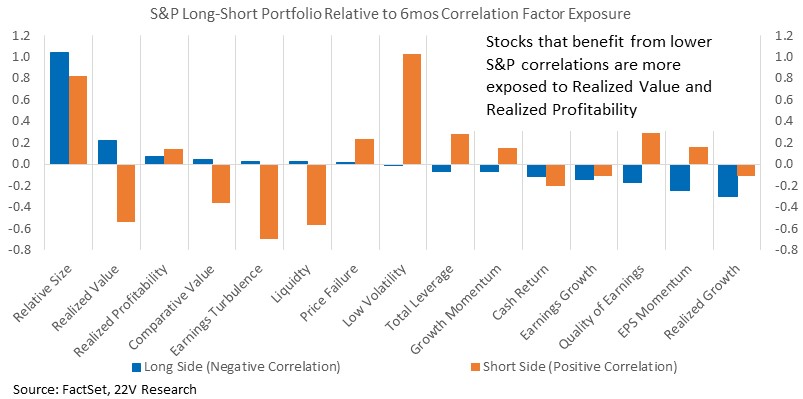
The long-side of the correlation breakdown portfolio is more exposed to Value factors, Realized Profitability, and Earnings Turbulence. The short-side is heavily exposed to Low Volatility. Those factor exposures are roughly in line with historical factor trends during periods of falling S&P correlation. At the end of this report, we list the stocks in the long and short side of this portfolio.
Positioning for a Declining Correlation Backdrop: After spiking earlier in the year, both short-term and long-term S&P correlation, measured using intra-portfolio correlation (IPC), has declined over the past two weeks. High macro uncertainty and the sharp tightening of financial conditions increased tail risk and drove correlations to levels not usually seen outside of recessions (details HERE). With uncertainty, at the margin, moving lower, the declining correlation trend should continue. Volatility measures are already reflecting those trends with equity, bond, and currency all rolling over.
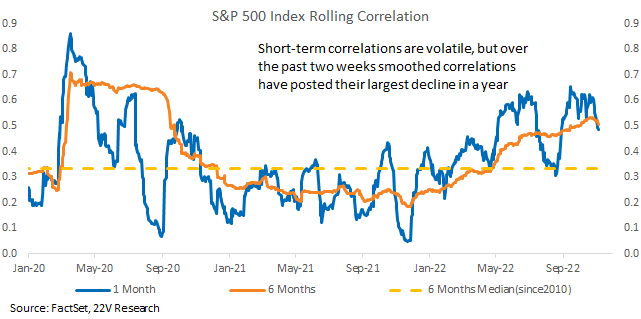
As 6mos correlation has rolled over, EPS Momentum, Realized Profitability and, Earnings Turbulence have been the leading factors, consistent with historical trends during periods of declining IPS. Both Realized Growth AND Realized Value have slid lower over the same period though, which is unusual. Realized Value returns have been very volatile over the past few weeks. With rank correlations between Value and Growth still unusually strong (near zero, normally they are negative), and NTM PEs of Value VERY high relative to Growth, expect ongoing volatility between those groups.
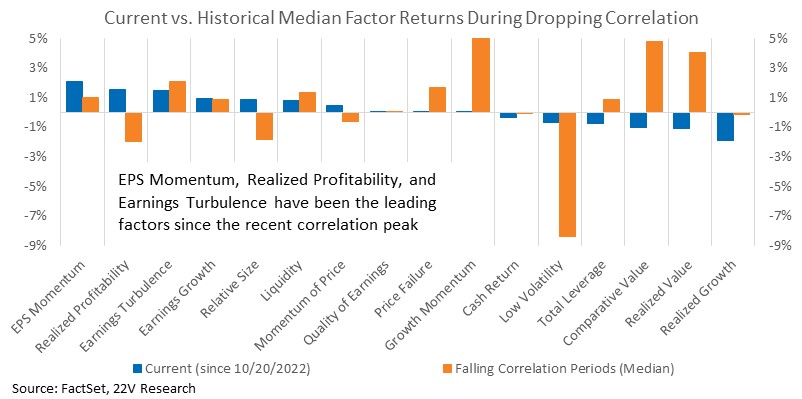
Market internals remain volatile with rotations being influenced by shifts in overall macro influence. Momentum groups have led factor returns in 4Q, while Growth has struggled. As index correlation dropped, risk-off factors rebounded a bit over the past week at the expense of risk-on factors and Value names. Those movements are more likely a result of concerns about further financial condition tightening being necessary to slow growth and inflation.
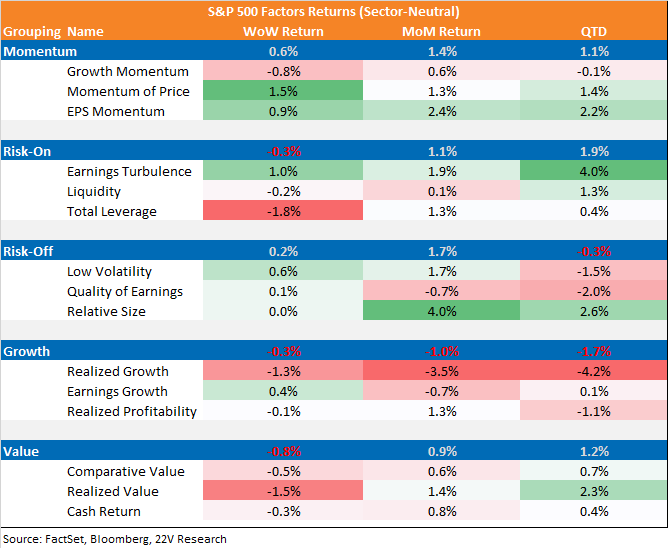
As S&P IPC continues to decline, the stocks most negatively correlated with it should benefit from the change at the expense of the names most positively correlated. This research series is designed to track how well stocks with negative relationships to changes in S&P correlation perform over the coming months as IPC mean reverts.
The long-side of the correlation breakdown portfolio is more exposed to Value factors, Realized Profitability, and Earnings Turbulence. The short-side is heavily exposed to Low Volatility. Those factor exposures are roughly in line with historical factor trends during periods of falling S&P correlation. The largest exposure of the portfolio is Relative Size, which has been a strong performer over the past month but has a VERY low hit rate (large gains in a few industry groups, modest declines across many industries).
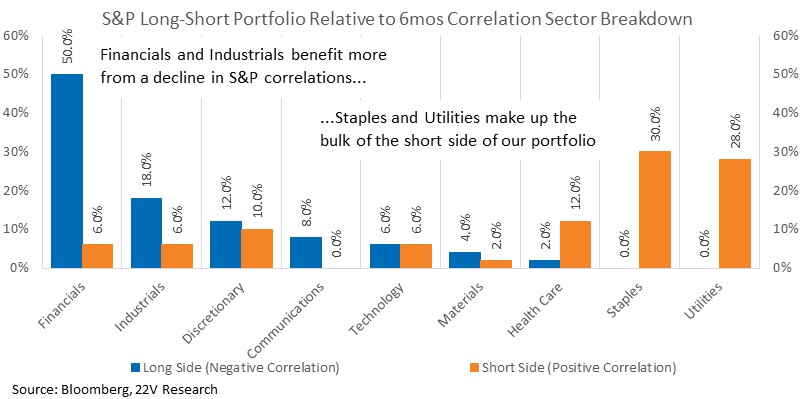
The sector breakdown of the long-short portfolio is divided between Cyclicals and Defensives. Financials account for half of the declining IPC portfolio (long-side) while Defensive Staples and Utilities account for 70% of the short-side. That allocation is consistent with our overall view that Cyclicals are more attractive as growth slow and risk-free rates increase. Defensive cash return yields are less attractive as risk-free rates backup, and their lower growth profile and relatively high valuations mean there is more opportunity in Cyclicals.
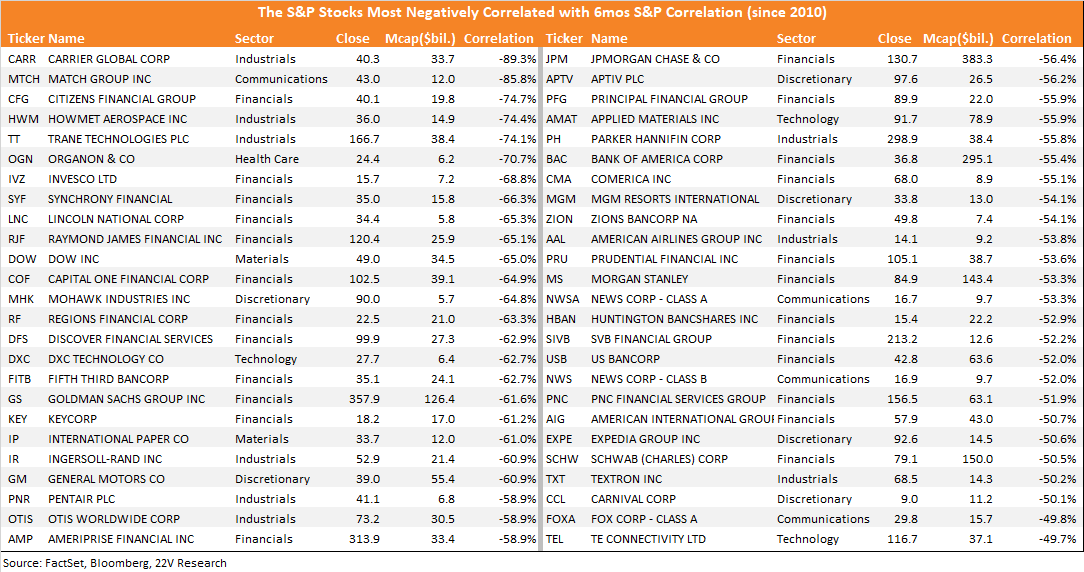
Below we list the long side of the portfolio. These are S&P names most negatively correlated with the S&P 6mo IPC (names that benefit from lower market correlations).
The names below are the short side of our basket. These stocks should struggle as macro tail risks decline and equity market correlations ease from their extreme level.