The third quarter is coming to an end amid renewed market weakness tied to rising yields, tighter financial conditions, and heightened recession risk. Market volatility is increasingly influenced by macro data/trends, which helped reverse the mid-June to mid-August rally.
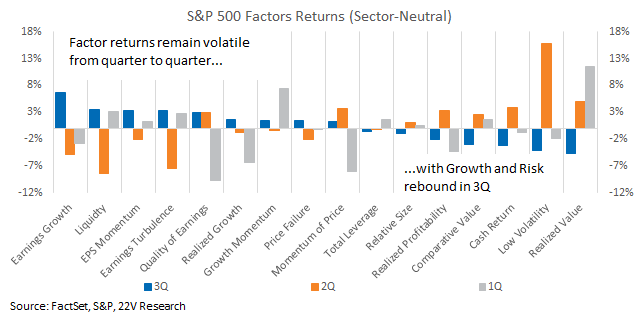
Factor returns were volatile as well. Growth and Risk-on factors rebounded in 3Q, buoyed by strong gains in July. Low Volatility, far and away the best-performing factor in 2Q (up 15%), was one of the worst performers in 3Q BUT has rallied more than 4% in September. As we have noted (HERE), high correlations + high economic uncertainty suggest repeated and strong risk-on/off rotations.
The only factor group that has consistently outperformed this year has been Momentum, especially Growth Momentum (report HERE). YTD, Growth Momentum is the third best performing factor (behind Realized Value and Low Vol) and has the second highest industry hit rate (behind Realized Value). Growth will slow further, and as that plays unfolds Growth Momentum should remain a strong screening factor across industries.
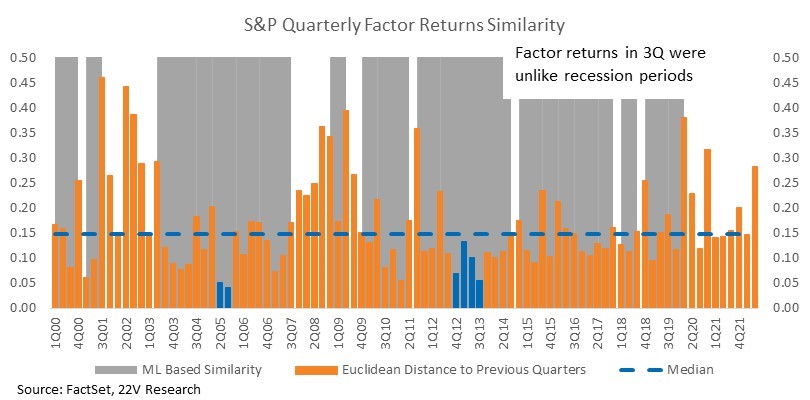
So, what do all those rotations tell us about the market backdrop? Applying the Euclidean distance and machine learning approach, we can compare quarterly factor returns to previous periods. 3Q factor returns were dissimilar to the past two recession periods and much closer to the 2012-2014 and mid-‘05 periods. That confirms our Macro Regime Model, which has been shifting away from recession over the past few weeks despite the market selloff. If economic growth collapses, market internals will follow the risk-off rotation of the past few weeks, but slower growth (without a deep recession) would support the risk-on rotation investors were positioning for in early 3Q.

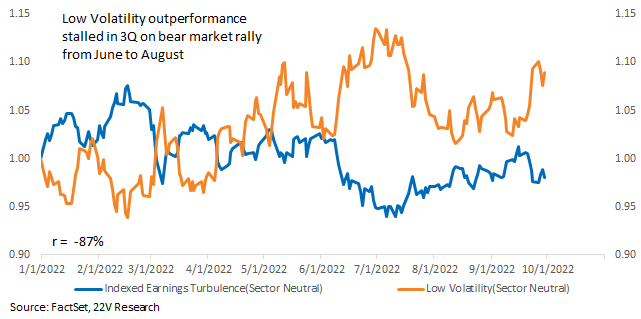
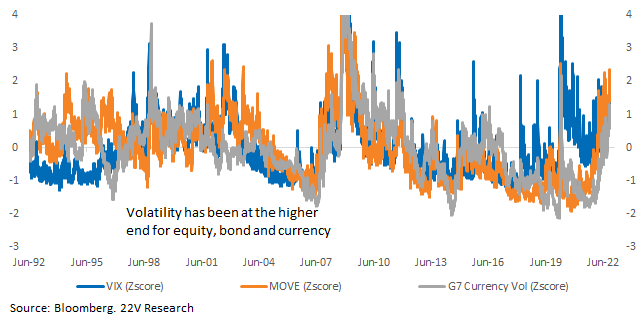
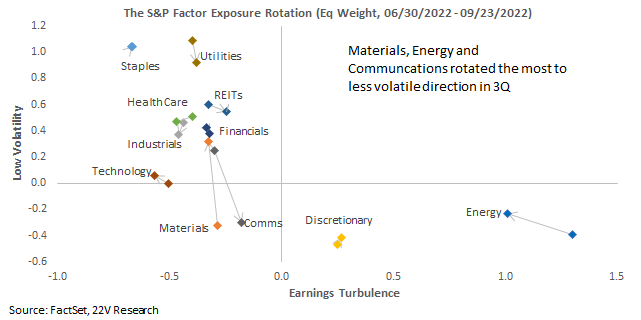
Near-term, volatility should remain elevated as the rate hike-induced slowdown plays out, but the trend in 3Q shows investors were discounting the return to a slower growth, more stable inflation/yield backdrop. Elevated market correlations and macro influence, along with volatility at levels rarely seen outside of recessions, suggest further risk-on/off rotations. Understanding risk factor exposures will remain VERY important into 4Q. Bear market rallies tend to see Low Volatility names plunge and Earnings Turbulence rally. Energy, Materials, Comms, and Discretionary are higher volatility (will struggle during risk-off rotations), while Energy and Discretionary are the only sectors over-exposed to Earnings Turbulence (benefit from risk-on moves).
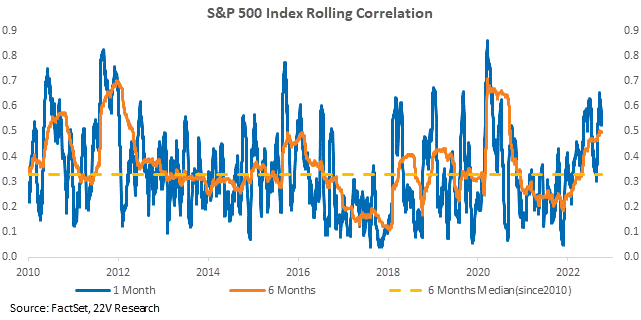
Factor Volatility was HIGH in 3Q: The third quarter is coming to an end amid continued S&P losses tied to rising yields, tighter financial conditions, and increased recession risk. Market volatility is increasingly influenced by macro data/trends, which supported a rebound from mid-June to mid-August. Since then, increased hawkishness from the Fed following the stronger-than-expected inflation report has driven a sharp risk-off move and spike in volatility, macro influence, and market correlation.
Factor returns were volatile as well. Overall, Growth and Risk-on factors rebounded in 3Q, driven by strong gains in July (during the market rebound). Low Volatility, far and away the best-performing factor in 2Q (up 15%), was one of the worst performers in 3Q overall BUT has rallied more than 4% in September. As we have noted (HERE), high correlations + high economic uncertainty suggest repeated and strong risk-on/off rotations.
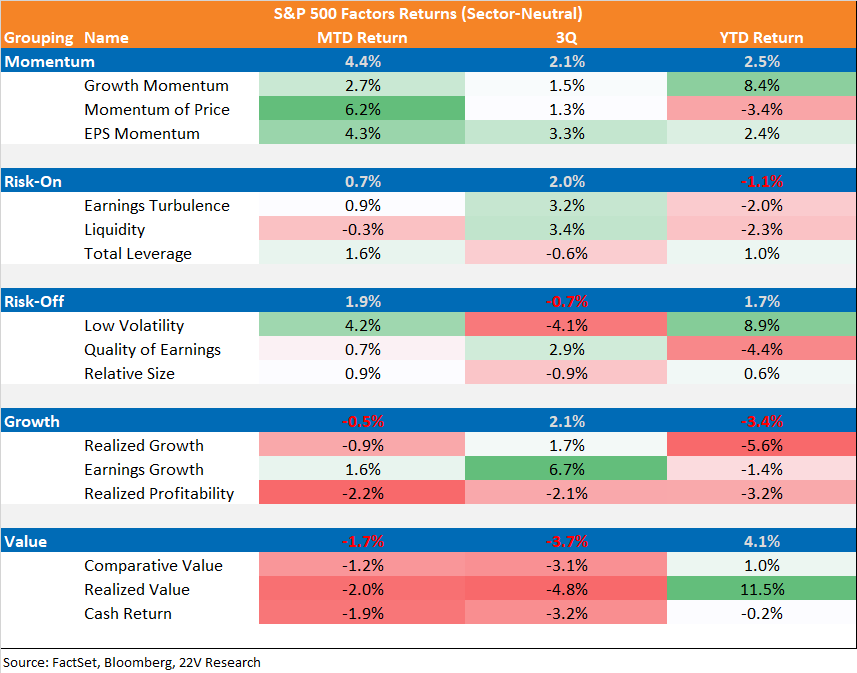
Factor group returns in 3Q diverged from factor returns YTD with Risk-On and Growth factors gaining while Risk-Off and Value factors underperformed until recently. The trend in September reversed for Growth and Risk-Off factors. The only factor group that has consistently outperformed this year has been Momentum, especially Growth Momentum (report HERE). As growth slows, Growth Momentum, measured using actual sales, cash flow, and earnings growth, should remain a strong screening factor across industries.
Investors Primed to Discount a Non-Recession Backdrop: The bear market rally earlier this quarter led to lower average volatility relative to 2Q and factor returns have also been different from past few quarters. Both Euclidean distance and machine learning based classification (using a Gaussian Mixture Model) show 3Q factor returns were more similar to the 2012-2014 than to 1) the COVID-ear or 2) recession periods. Recession probability, based on our regime classification model, fell into August (report HERE) on better PMI and yield curve steepening, leading 3Q factor returns to diverge from historical recessions.
No Near-Term Reprieve from Risk-on/off Rotations: Market rotation between risk-on and risk-off factors have been frequent and rapid this year, driven by changes and financial conditions. Bear market rallies led to a plunge in Low Volatility names while bear market declines support Low Vol gains and a rotation out of Earnings Turbulence.
As market volatility, measured across asset classes, remains at a level rarely been seen outside of Recessions, and market movements have become more macro dependent, continued risk-on and risk-off rotations are likely.
Most sectors now are falling in the Low Volatility and low Earnings Turbulence basket. Over the third quarter, Materials and Communications became MUCH LESS risk-off, but they remain low Earnings Turbulence. Energy and Discretionary are still the most risk-on friendly sectors. Energy remains to be the most volatile sectors with the highest Earnings Turbulence and the second lowest Low Volatility, behind only Discretionary.
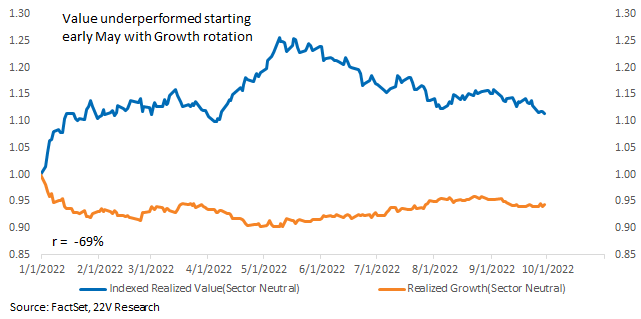
Comment on Style: Value vs. Growth has been a less effective screening tool than risk-on vs. risk-off factors this year. Value gained significantly prior to May but has been underperforming as economic growth slows. Value lost -11.3% from its peak early May, while Realized Growth only gained 4.7% over the same period, narrowing its YTD decline to -5.6%. The Style trade will be more attractive when 1) the outlook for policy/growth stabilizes, and 2) rank correlations between Value and Growth names decline. The next most likely phase of the Style rotation is a one of Growth leadership.