Summary – Super Important Point That Investors Need to Internalize: Last October (when we launched) we made a high conviction call financial conditions needed to tighten aggressively and short and long rates were headed higher. We moved off that call too early (late April/May). We didn’t think financial conditions would ease, just that the case for them to tighten much more was not easy. Anyway, now we have a different call that we believe is underappreciated.
Here it goes: Economic growth is set to slow, potentially aggressively, and 10yr yields are near the high end of their range. We would be long 10yr bonds.
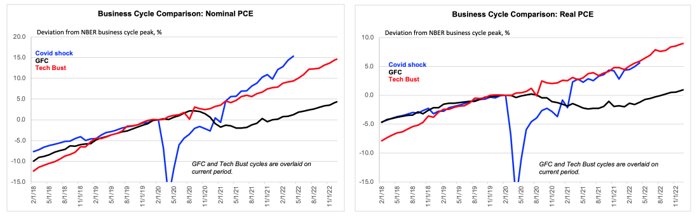
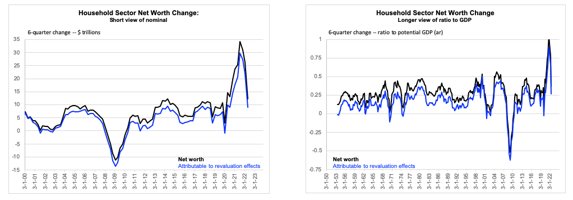
Here is why: The recovery of nominal personal consumption expenditures (PCE) in this expansion has been extremely powerful, outpacing other recoveries by a very wide margin. The trend growth rate recently has been about 10% (ar). As Gerard has pointed out though, nominal spending is now set to downshift. Consumer spending strength, especially nominal, has been supported by a credit impulse that is near a record high. That near record high in the credit impulse was supported by the surge in consumer net worth (mortgage equity withdrawal with home price appreciation + surging asset prices). That credit impulse, which has to go UP to support the current level of spending, is likely to stall and potentially roll over as the CHANGE in household net worth suggests a lower credit impulse going forward. The 6-quarter change in household wealth creation was very strong, encouraging a realization through credit use, and have since faded.
Simply put, a near-record credit impulse drove a shift in spending that was WELL above other post-recessionary periods. Who knows how much spending will slow from here, but it could significant. The NY Fed DSGE model now has 10% odds of a soft landing and a hard landing in the 80% range. The definition of a hard landing being four quarters whose average growth rate is less than -1%.
Side note. How hard of a landing we may encounter will likely be determined by how “flat” the Phillips curve really is. It is worth reading about this subject here.
Other things contributing to the coming slowdown: capex plans have collapsed, credit spreads are moving wider globally (Europe a problem), and the breadth of housing data is already weakening.
The consumer still has some “reopening momentum,” which is why the timing on these calls is always tough, but the direction of travel seems clear. Economic growth will slow and inflation will eventually follow. Like it always does.
Push back: For what it’s worth, the most aggressive push back on being short 10yr yields now came from the equity community. The macro and fixed income community has been more receptive. Our sense is that macro investors focus more on the magnitude of financial conditions tightening and the impact it will have on an economy that still has very low trend growth (1.8%ish). And how inflation has been driven by HIGHLY unusual shocks combined with central bank mistakes (a mistake that the Fed is working hard to reverse now). The equity folks seem to think we are in a higher nominal GDP regime (inflation) and real rates need to be MUCH higher to offset that. The other counter argument we hear frequently is that the Fed will be unwilling to slow economic growth aggressively, leading to persistently higher 10yr yields and inflation that remains well above the 2% target. We would agree inflation in a 2-2.75% range is possible (opportunistic disinflation), but anything well above that is highly unlikely. Inflation expectations agree.
Factors: Low Vol has been the best factor BY FAR, but very volatile. It has also been the BEST trading factor, especially vs Earnings Turbulence. To the extent that we have some relative calm in the markets over the next few weeks (and the unprecedented stats on the selloff suggest that is possible), Low Vol will come under pressure. We looked at Bear market rallies and the pattern is pretty consistent – Earnings Turbulence and Price Failure consistently outperformed at the expense of Low Volatility and Momentum of Price. At the sector level, Technology and Discretionary outperform in a bear market rotation.
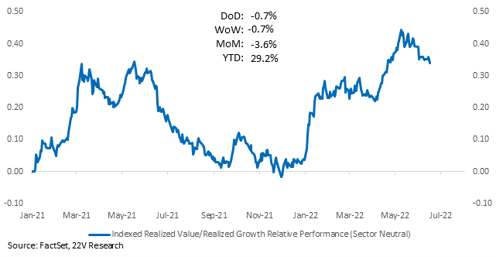
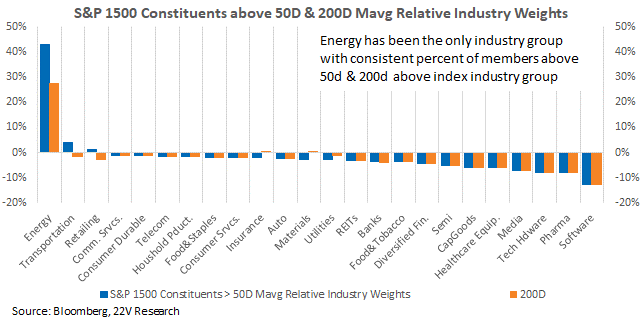
Market Stats: Energy is propping up the percent of S&P constituents trading above their 50 and 200-day moving averages, which is still down to the 2nd percentile. If the economic slowdown story starts to gain steam, Energy has some risk. We also have a list of stocks that are most levered to a bear market rally. Separately, Growth has started to outperform Value, which is unusual relative to previous market declines. Market internals could be picking up on the economic growth slowdown that is becoming more obvious.
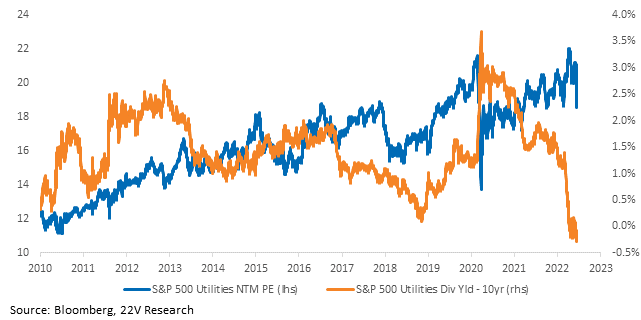
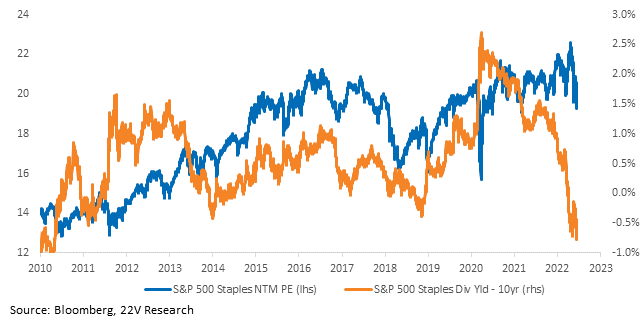
Defensives FYI: The dividend yield spread between Utilities and 10yr yields and Staples and 10yr yields has collapsed. Both Staples and Utilities have dividend yields below 10yr yields. Staples are even more negative. Both sectors have relatively high PEs. Defensives need significant drawdowns in the equity market to work.
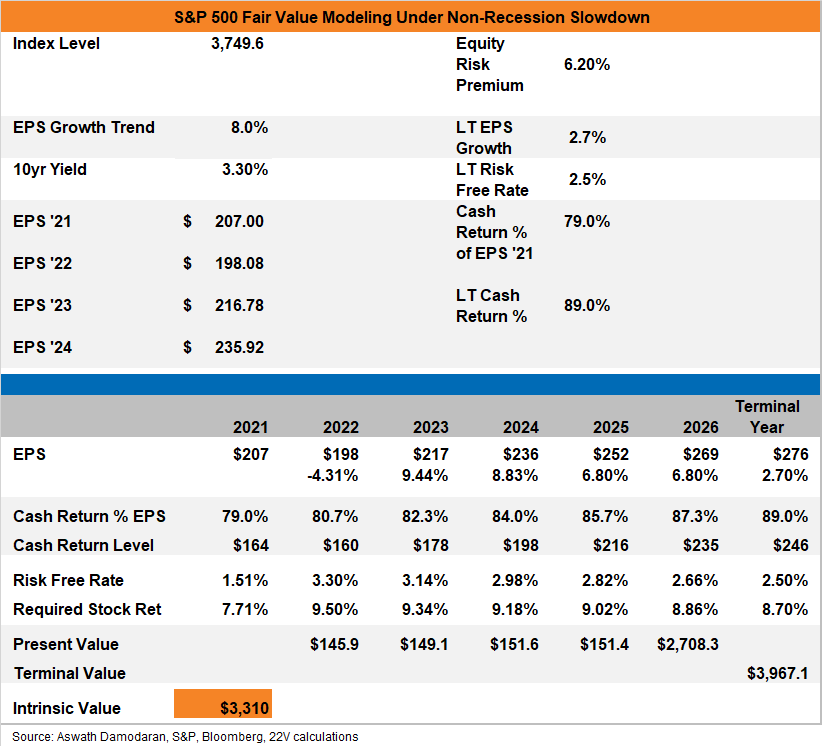
Buying The Market, Longer Term, Is Tough: But if we assume a mild-recession scenario where 2022 revenue growth is half current expectations (~5.4%) and margins decline a full point (to 12.4%) persistently, S&P fair value is around 3310, about -12% from yesterday’s close. But that requires the ERP to remain in its 97th %tile. That discounts an earnings cadence of $198 in 2022, $216 in 2023, and $235 in 2024.
Full set of charts that support what we wrote about above are below…
Macro Backdrop: The recovery of nominal PCE in this expansion has been extremely powerful, outpacing recent recoveries by a very wide margin. The trend growth rate recently has been about 10% (ar). Higher inflation has cut into real PCE, obviously. Indeed, some of the strength in nominal spending has probably reflected consumers viewing the “micro” part of higher inflation as a transitory shock to real income and looking through it by dialing up nominal. But the point is that nominal spending has been extremely strong. It is now set to downshift.
If consumer spending strength, especially nominal, were being driven by people dipping into “excess savings”, then why would the credit impulse be near a record high? The point is not that borrowing is excessive, but that it has supported strength of consumer spending growth. (NB: It is somewhat arbitrary that the credit impulse shown as an 8-q swing is near its modern era record. The 4-q quarter rate has moved higher more erratically but makes a similar point qualitatively).

At the peak of the market, household sector net worth measured quarterly was up $40 trillion relative to the Covid low quarter, Q1 2020. In the chart below, we use a 6-quarter change to conform with the consensus take – crudely – on how wealth effects work. They were very strong, encouraging a realization through credit use, and have since faded. This story is hard to quantify, but qualitatively it seems to accord nicely. It is not about dipping into savings, an ad hoc concept to boot.
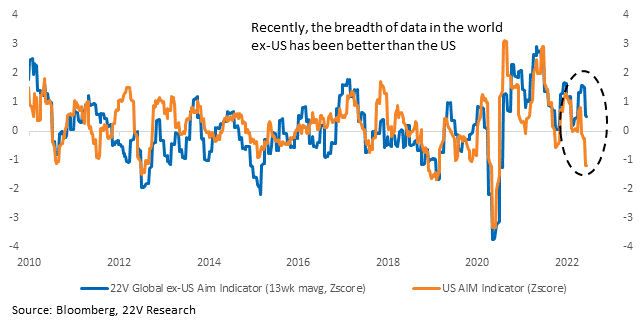
The breadth of US economic data has rolled (breadth does not imply significance – spending and labor data in the US are still too firm) and rest of world data is following. The global economy is going to slow aggressively…
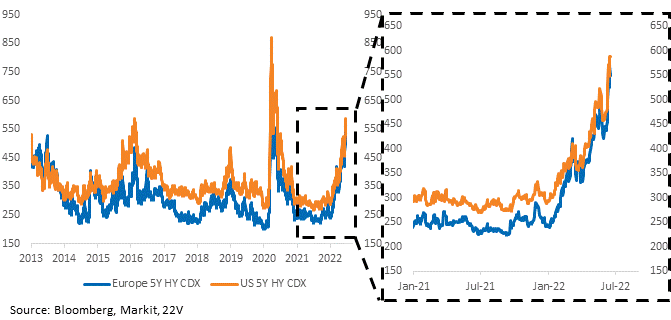
…and with financial conditions tightening at the same time, credit spreads continue to come under pressure. US HY CDX spreads have moved wider, but the move in European credit spreads has been more aggressive. Weaker business spending will follow wider credit spreads and weaker business spending will be a significant drag on economic growth.
Interestingly, Growth has outperformed on this latest move lower in markets and that is a departure from previous selloffs. Market internals could be picking up the sharp slowdown in economic growth that credit spreads, broader commodity prices (see CRB RIND), and inflation expectations are reflecting.
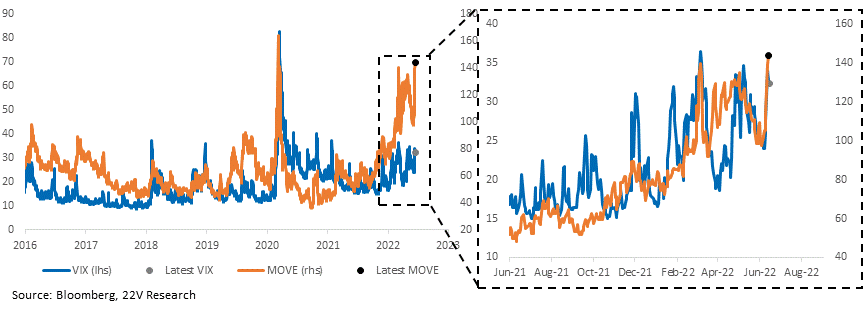
Bond volatility has surged and will keep upward pressure on the VIX, but it is tough to expect bond volatility to move significantly higher from here, which is why we think risk assets should stabilize some. The data rolling over (particularly consumer spending data) is critical for bond vol moving lower.
Defensives Focus: Both Staples and Utilities have dividend yields below 10yr yields. Staples are even more negative. Second, both have relatively high PEs. As we point out in a Quant report, the low volatility factor can still work (Defensives highly exposed to low Vol), but it requires large drawdowns. In our mind, that means you need another rate shock that sends the equity markets another -10% for Staples/Utes to work OR a clear downside economic shock. It could happen, but the quiet periods in between will be increasingly difficult for Defensives.
Fair Value a Bit Dodgy: With the 10yr now up to 3.4% and the implied equity risk premium, under 22V specs, up to 6.22% (99th% tile historically), S&P fair value has declined. Our assumptions are 1) that low productivity means slow growth and a low (2.5%) longer-term 10yr yield, 2) EPS growth trend of ~8%, and 3) that long-term S&P EPS growth will remain modestly above the 10yr (proxy for economic growth). Under that framework and assuming a mild-recession scenario where 2022 revenue growth is half current expectations (~5.4%) and margins decline a full point (to 12.4%) persistently, S&P fair value is around 3310, about -12% from yesterday’s close. But that requires the ERP to remain in its 97th %tile.
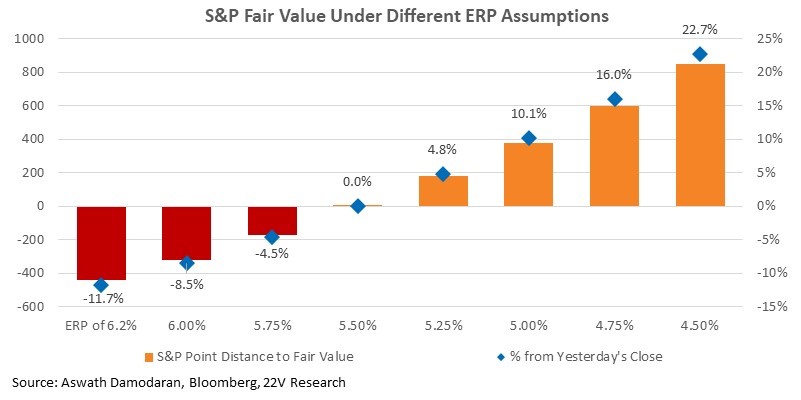
If inflation remains high and Fed rhetoric becomes more aggressive, the ERP could move even higher, driving fair value lower. But, from current levels, the return skew is again becoming attractive, even under a recessionary earnings drawdown.
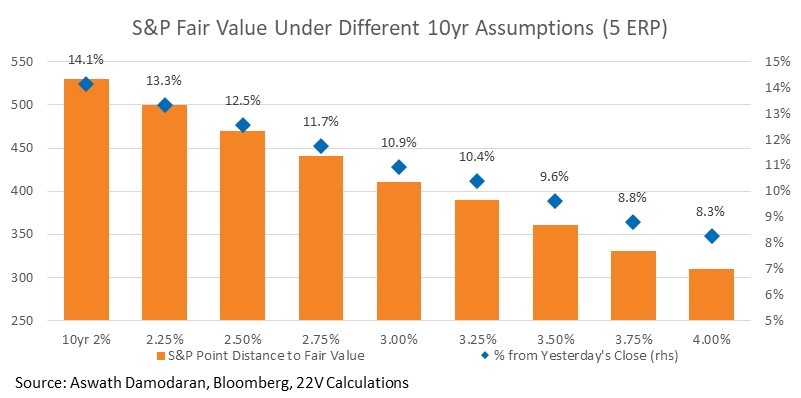
The key to getting equities meaningfully higher is a combination of slower growth and a decline in the equity risk premium. Fed rate hikes and global central bank tightening will bring about slower growth. The question is how fast-growth needs to slow to generate a policy-friendly inflation trend. Slower growth that DOESN’T trigger a sharp recession, should lead to both lower 10yr yields AND a lower equity risk premium. Under that backdrop, there is a good amount of upside to equities. Unfortunately, the case for a slowdown without a recession is getting harder.
Market Stats: he percent of the S&P above their 50-day and 200-day moving averages have dropped to 2.0% and 12.8%, respectively. That’s consistent with bear markets, suggesting a broad recovery if a recession can be avoided.
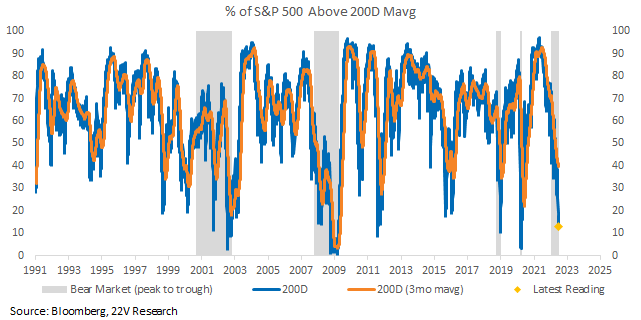
Energy is propping up the percent of S&P constituents trading above their 50 and 200-day moving averages, which is still down to the 2nd percentile. Energy is driven by oil prices. Risks are accumulating within Energy; slower economic growth should lower oil prices.
Price Failure has the least stocks above their 50-day and 200-day moving averages. It’s likely to rebound if there’s a rally, especially for the names with high pricing power listed below.
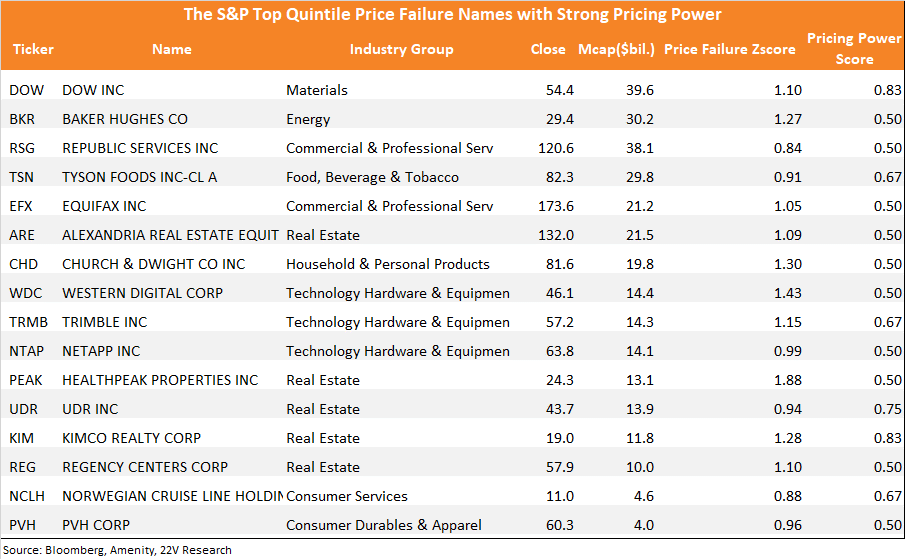
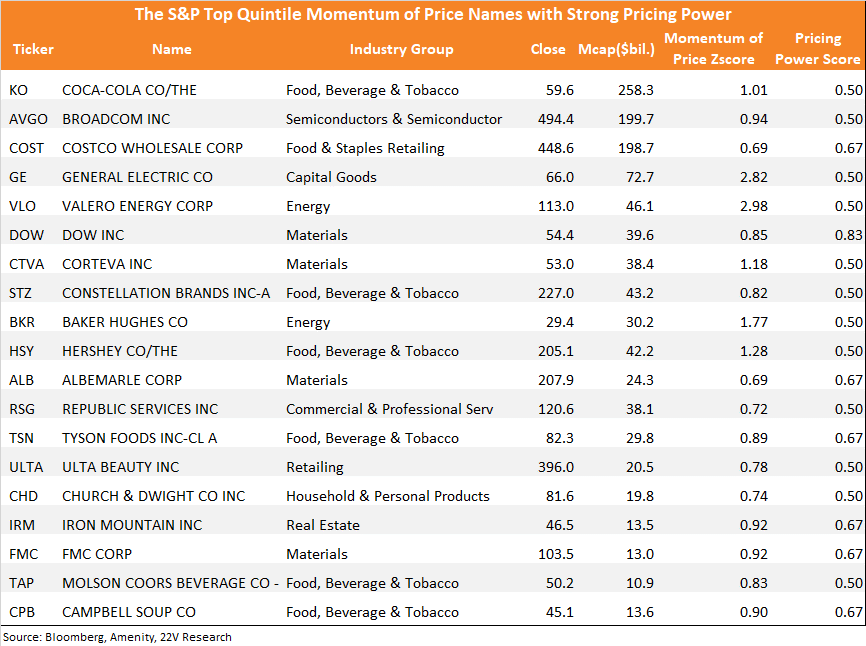
If the market decline continues, high Momentum of Price names will likely continue to outperform. Below are the S&P names with high Momentum of Price and strong pricing power, which should be favored during a deeper bear market.