Mary, Mary…Why ya buggin’?
There was no intention for this to be a Run-D.M.C week, but Sunday night’s, “It’s Tricky” just naturally morphed into today’s “Mary, Mary…Why ya buggin’?” And we think you’ll understand why because yesterday San Francisco Fed President Mary Daly emphatically said, “we are not behind the curve, we are not behind the curve at all.” And we immediately thought, she’s gotta be buggin’ which is really just an updated version of, “The lady doth protest too much, methinks.”
CPI data shows 9 months in a row of year / year gains of at least 4% with December’s year / year figure of 7% the highest in 40 years and
PPI data show 10 months in a row of year / year gains of at least 6% with eight of the last nine months posting year / year advances of at least 10%! The 13.3% year / year figure for November 2021 was the highest seen since August 1980 and
The 2-year Treasury yield is sitting at 1.15% is 193% above its 200-day moving average and has been 200% above its 200-day moving average for six of the last 11 days.
While CPI and PPI rates of change are unusual because they haven’t been seen for 40 years, it’s not because they are unprecedented. However, the action in the 2-year Treasury yield is historically unequaled, unmatched, unprecedented, and unrivaled. We know the Fed is busy working on climate change, but if the 2-year Treasury yield is any guide then the Fed is not only behind the curve, but they’ve also had their collective knees buckled by the curve (just like what Yoervis Medina did to Alexi Ramirez in this video; it shows up at the 50 second mark; there are others, too).
Ms. Daly need not fret too much, however, because she – and the Fed – are not alone. Virtually the world over CBers are having as much trouble with the curve as batters did when the inventor of the pitch, Candy Cummings, first introduced it while playing for the Brooklyn Excelsiors in 1867. Christine Lagarde (ECB; “Plus ca change, Ms. Lagarde?”), Philip Lowe (Reserve Bank of Australia), Tiff Macklem (Bank of Canada), and Andrew Bailey (Bank of England) are all just standing in the box with the bat on their shoulders bedeviled by the curve. Are they working on climate change, too?
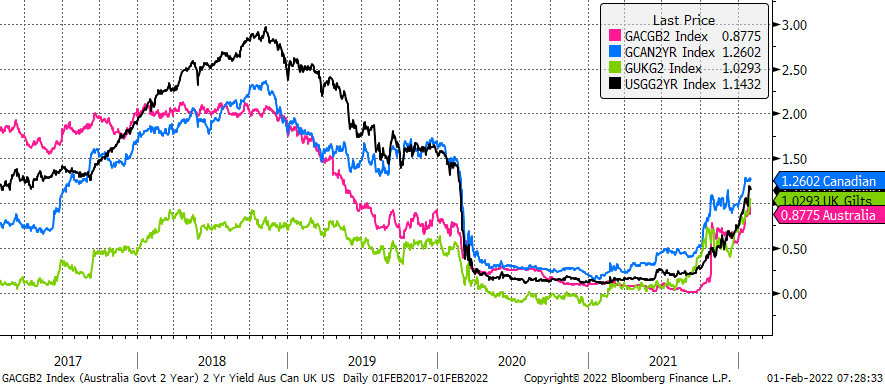
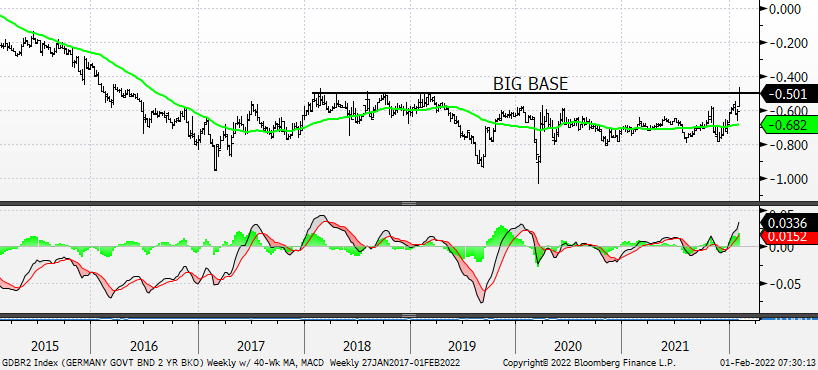
The 2-year yield in Australia is 245% above its 200-day moving average, in Canada the 2-year yield is 100% above its 200-day moving average, and in the UK the 2-year yield is 213% above its 200-day moving average. And the CBer who is having the most trouble is Andrew Bailey as the 2-year Gilt yield is already above its 2018 high. Meanwhile, Germany’s 2-year Bund yield is thisclose to breaking out above its 2018 high giving Ms. Lagarde, we suspect, more than a bit of agita. A comparable figure for the 10-year Treasury yield, currently at 1.15%, to get to its 2018 high would be 3%!
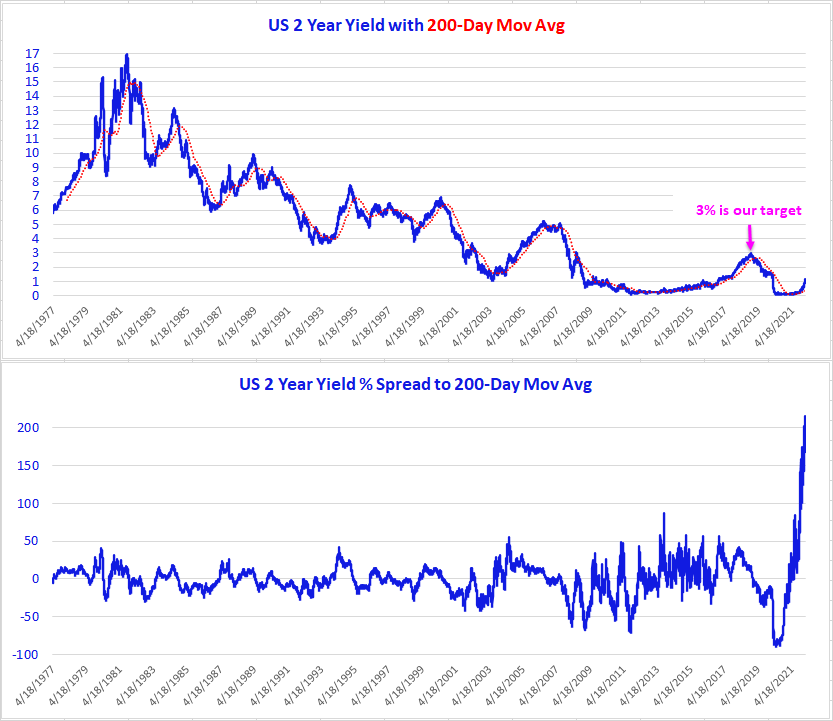
Source: 22V Research
2 Year Yields for Australia, Canada, UK and US
German 2-Year Yield – Thisclose to moving above its 2018 – 2019 highs.
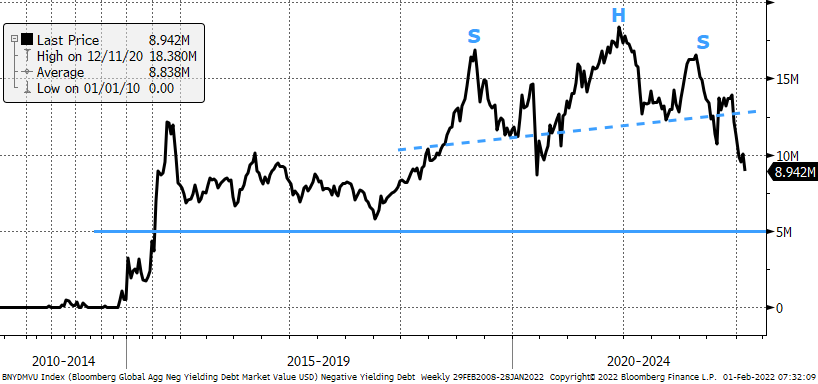
Negative Yielding Debt failing