Source: Google Image
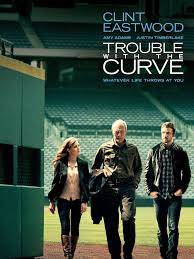
Trouble With the Curve was a Clint Eastwood movie from 2012 that also starred Amy Adams and Justin Timberlake. Eastwood played an aging baseball scout who was being marginalized by his employer, the Atlanta Braves, as he was “old school” and unwilling to accept the advanced statistical analysis being more widely used in organized baseball. Eastwood reluctantly accepts the help of his daughter (Amy Adams) and they – she, really – discover a left-handed pitching prospect who had, up until then, gone unnoticed by all major league scouts.
Updated for today we can say that Trouble With the Curve stars an ever-increasing number of dubious bond investors and a Federal Reserve that resembles Eastwood’s feckless chief rival for his job.
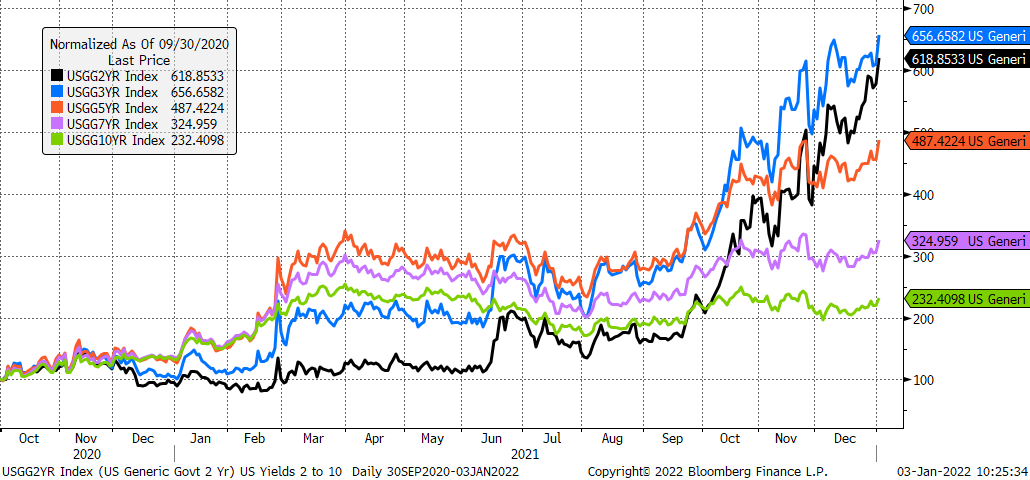
Chart shows US Yields from 2s – 10s indexed to 100 as of 9/30/2020
For the second time in the last five days, we’ve seen upside gaps for the US 2 Year Yield while 3s – 10s all gapped to the upside today. The upside gaps reflect the greater positive yield momentum and make it clear that bond investors are becoming increasingly wary of holding Treasuries. And who can blame them? What with CPI at its highest level in 40 years and PPI at its highest level in 41 years the bond market is intent on putting the Fed’s collective feet to the fire.
Via our conversations with investors, we get the sense that there is a great conceit that “inflation will cool in 2022.” We continue to view this idea curiously because this bit of investor sentiment comes from the same folks who believed inflation wouldn’t be high in 2021! It’s our take that inflation will remain high and prove to be a continuing problem for the Fed and yields will work higher, too.
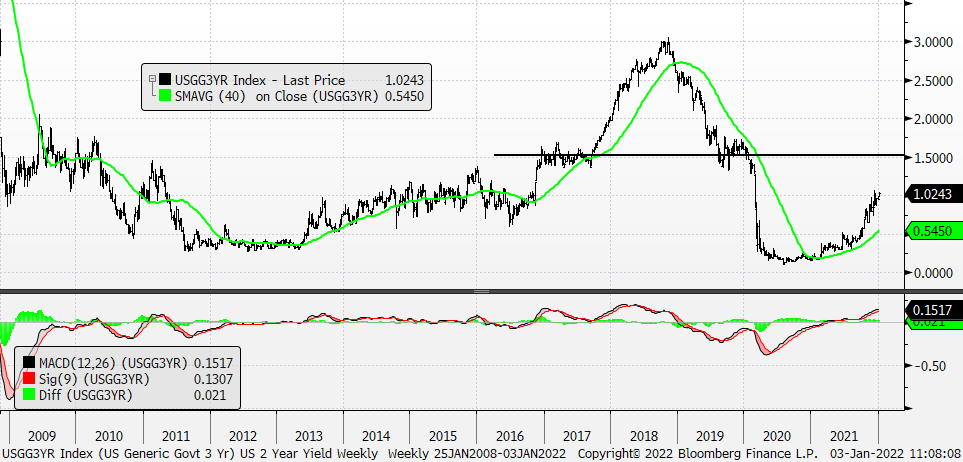
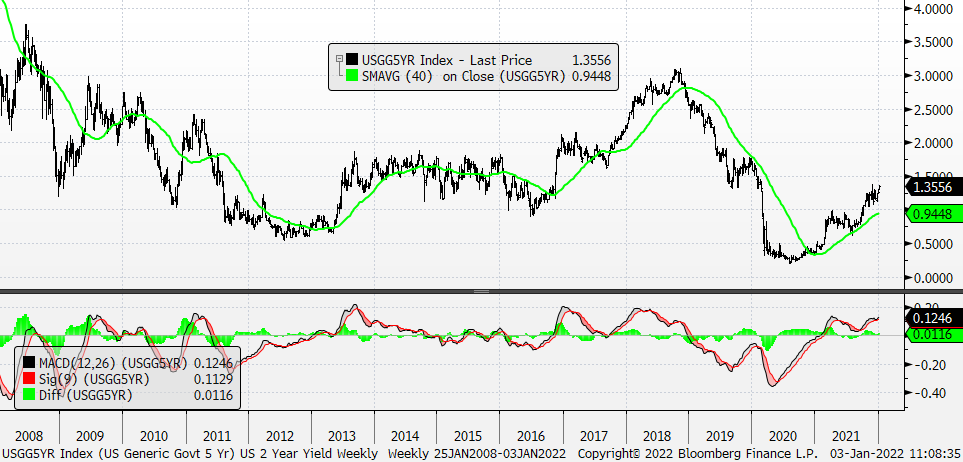
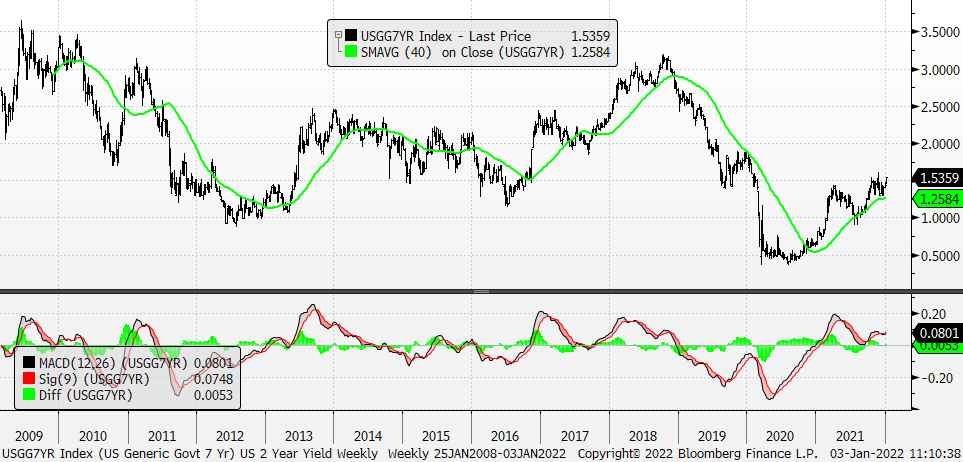
As you can well imagine, Technical Scores are strong across the board for 2s – 10s. 30s, meanwhile, continue to post a Neutral Score.

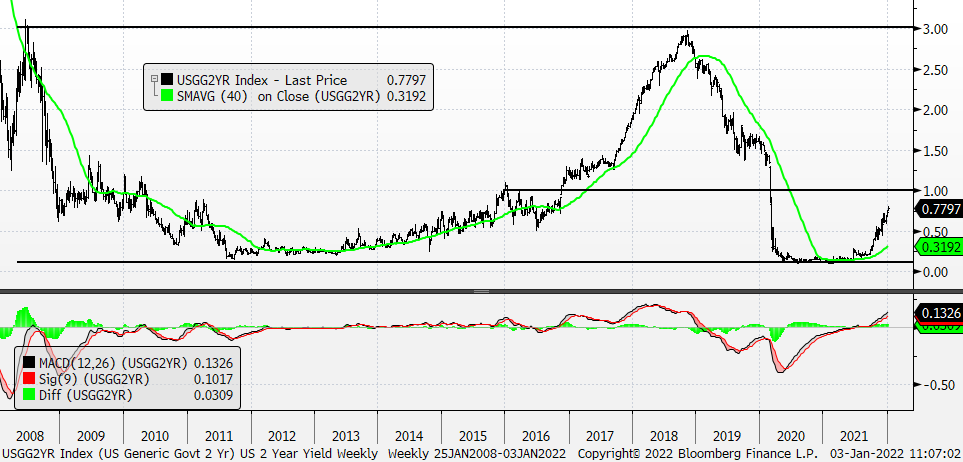
2’s moving closer to the 1% target level
3’s
5’s – We’re looking for the 5 Year Yield to break out next.
7’s – Will follow 5’s
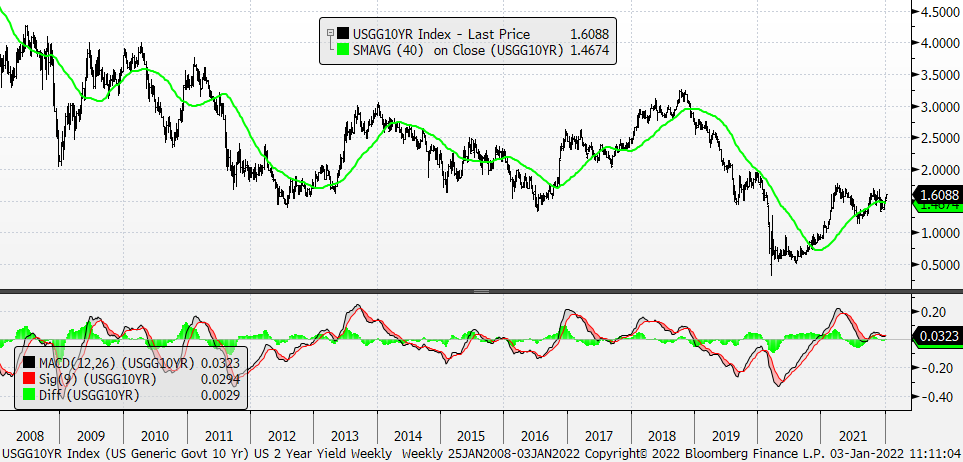
10s – Still in its range