
Our entire repository of COVID charts is HERE.
We have been emphasizing the risk that Omicron poses to supply chains through COVID-zero in China, difficult-to-predict policy responses under potential Omicron waves elsewhere in Asia, and labor shortages. Supply chain sentiment is deteriorating significantly. Supply chain constraints could delay goods deflation at an inopportune time. Rent inflation is hard to predict but should trend persistently higher soon. And, as we have been writing in our Strategy Daily reports, the Fed is committed to curtailing inflation by tightening financial conditions. It would be convenient if goods deflation kicked in while rent inflation increased, but supply chain trouble threatens that.

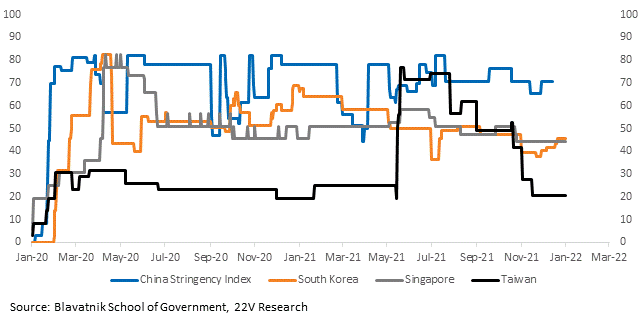
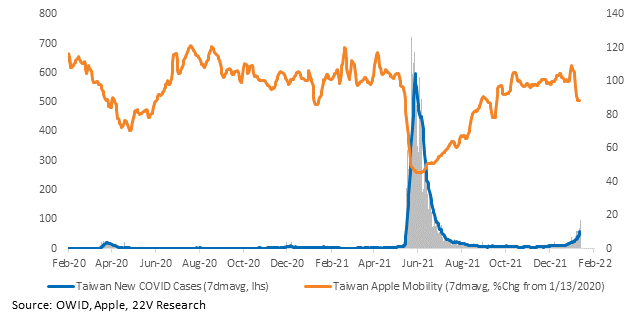
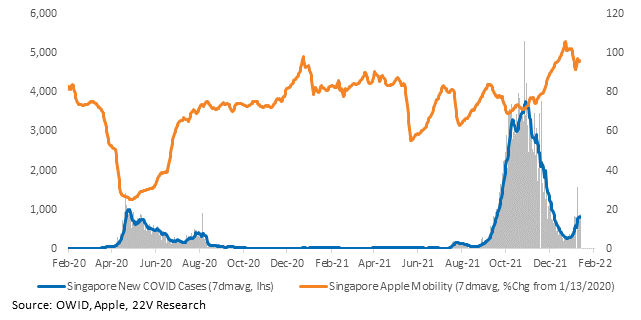
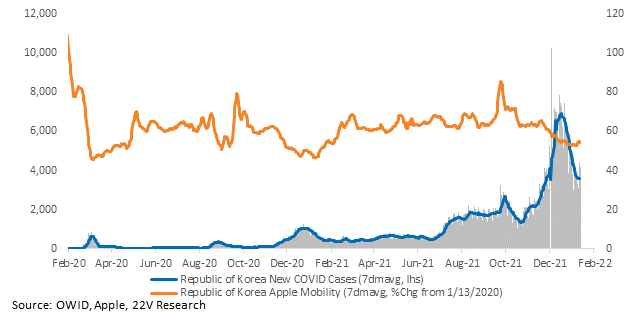
Oxford’s stringency indices will help us track restrictions throughout Asia. China’s score hasn’t been updated, but China recently locked down a third city, bringing the tally to 20 million people confined to their homes. Taiwan’s, Singapore’s, and South Korea’s restrictions are easier than during the winter and Delta waves. But Omicron case growth there is nascent.
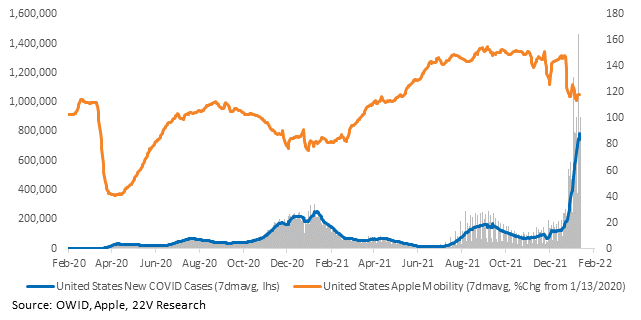
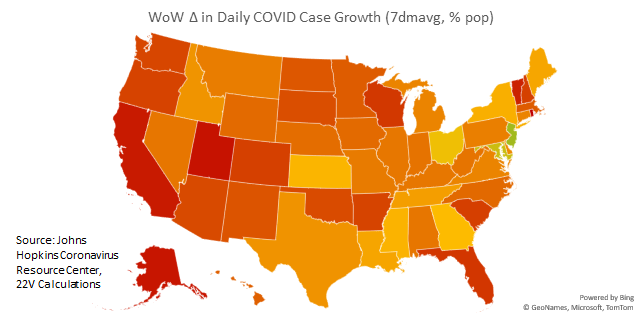
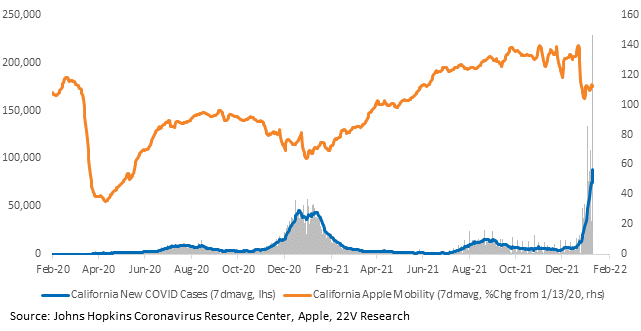
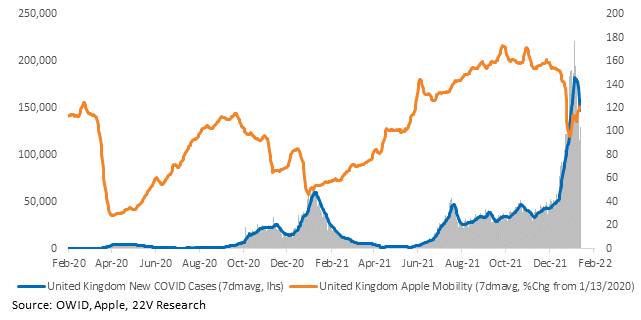
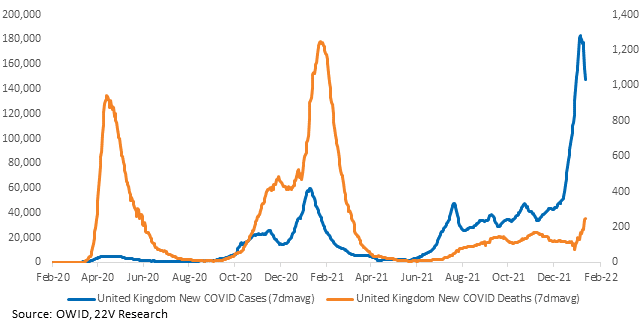
Cases continue to increase in the U.S. Growth is accelerating on the West Coast, but may be relenting in the NYC-metro area, the first location to experience an Omicron wave. That would be evidence of severe but fast waves, similar to what was seen in the UK.
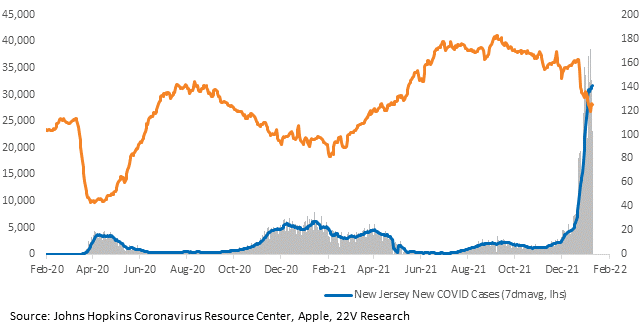
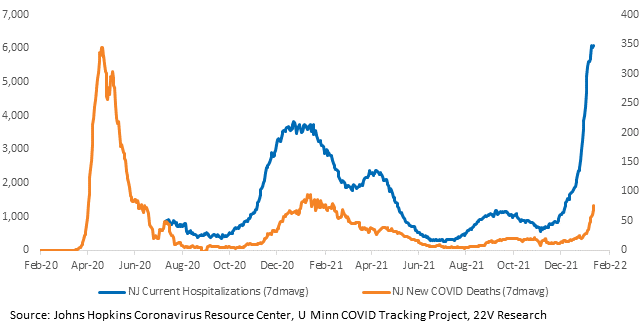
New Jersey and New York are making progress; New Jersey’s average case growth is decelerating and New York’s 7dmavg fell for the first time during the Omicron wave. Mobility has bounced slightly in both and deaths have stayed low despite record case growth.
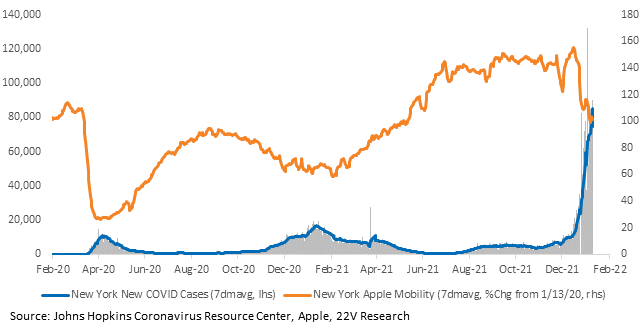
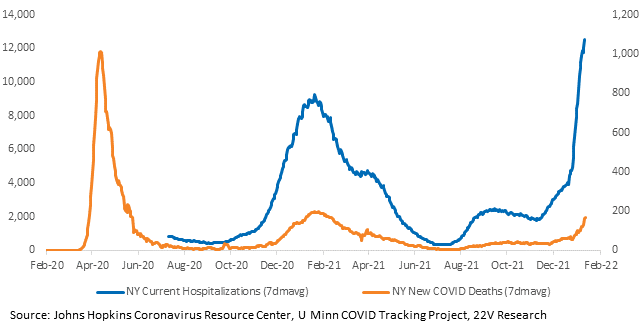
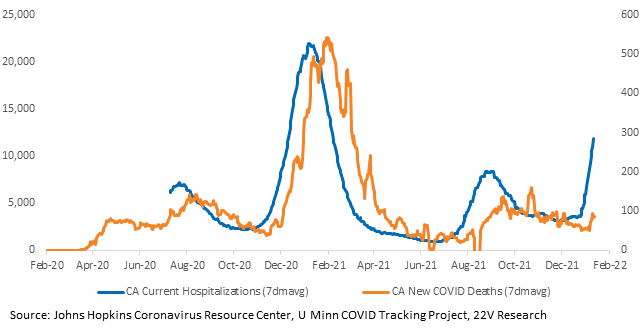
Case growth has jumped in California. Hospitalizations are beginning to follow. And California has an acute hospital staffing crisis.
The Northeast appears to be following the same pattern as the UK. That’s encouraging; mobility is recovering in the UK and deaths have stayed low.
Charts for every state and country we have data for are HERE.

