
Our entire repository of COVID charts is HERE.
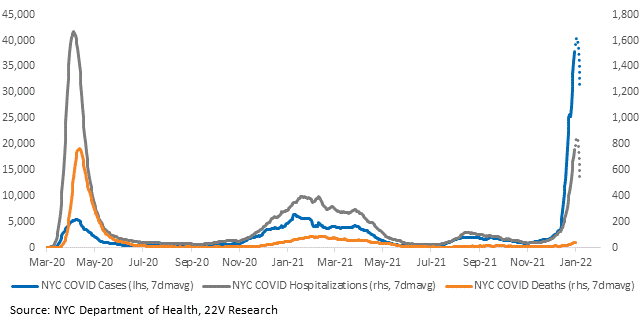
We have seen headlines today about a peak in case growth in NYC. We would note that the data that is referenced has been tagged incomplete by the city’s health department. The preliminary data is encouraging but can often be misleading. The more important and more reliable takeaway from the data is that deaths are still very low despite record case growth.
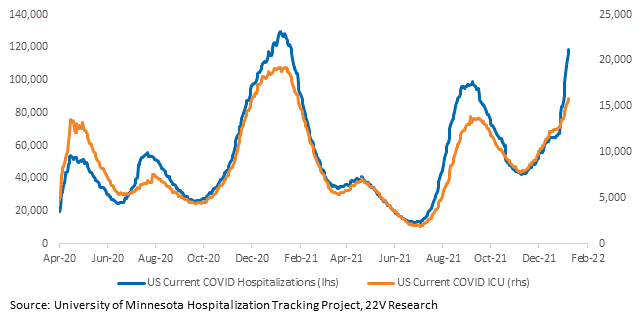
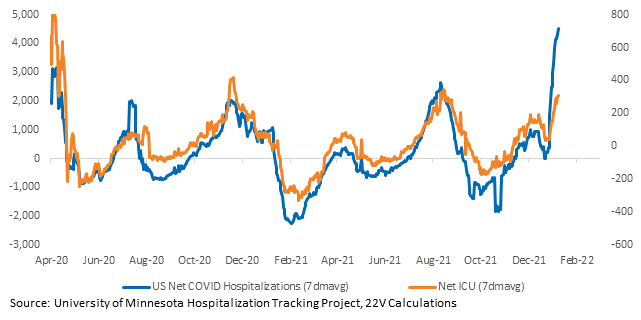
Omicron is not a significant demand shock thanks to its lower severity and new treatments. But, as the Omicron wave intensifies, it is creating significant staffing shortages in hospitals, threatening the care patients are receiving and leading to another round of pauses for elective surgeries. The percentage of hospitals anticipating a “critical staffing shortage” is at a post-vaccine high. So too are the number of people currently hospitalized with COVID and the number in the ICU with COVID. One notable bright spot – net ICU admissions have diverged from net hospitalizations. Less of those being hospitalized are in critical condition. Staff shortages need to move off the front page before politicians think about easing restrictions.

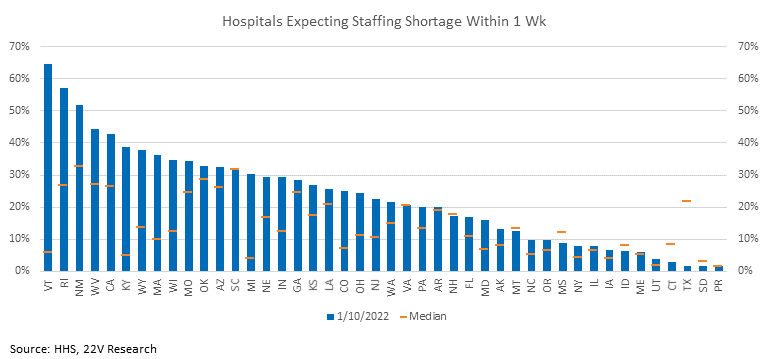
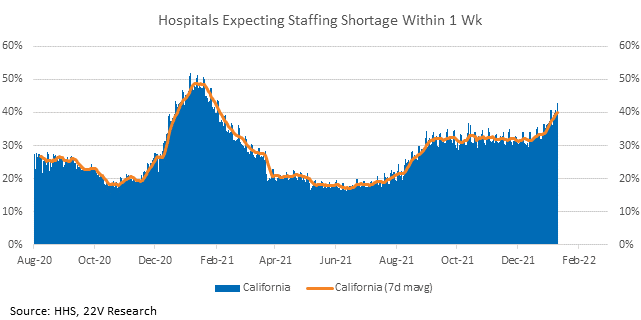
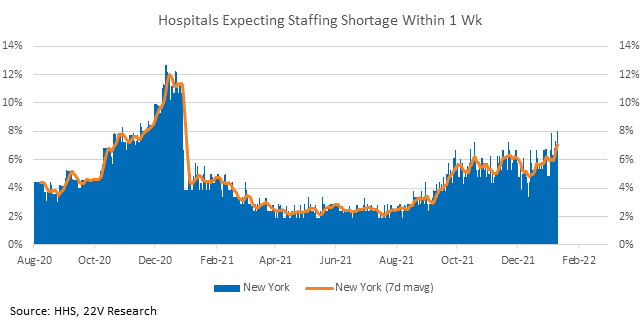
The staffing shortage is hitting almost every state; only a handful of states have fewer hospitals reporting an imminent critical staffing shortage than at their pandemic median. Small states have the highest percentages (VT, RI, NM) but California’s percentage is troublingly high (over 40%). That explains California’s new guidance for healthcare workers; asymptomatic, COVID-positive health care workers can stay on the job (they’ll be wearing respirators and hospitals will “try” to assign them to COVID patients). NY’s percentage is much lower (8%) though it is also at a post-vaccine high.
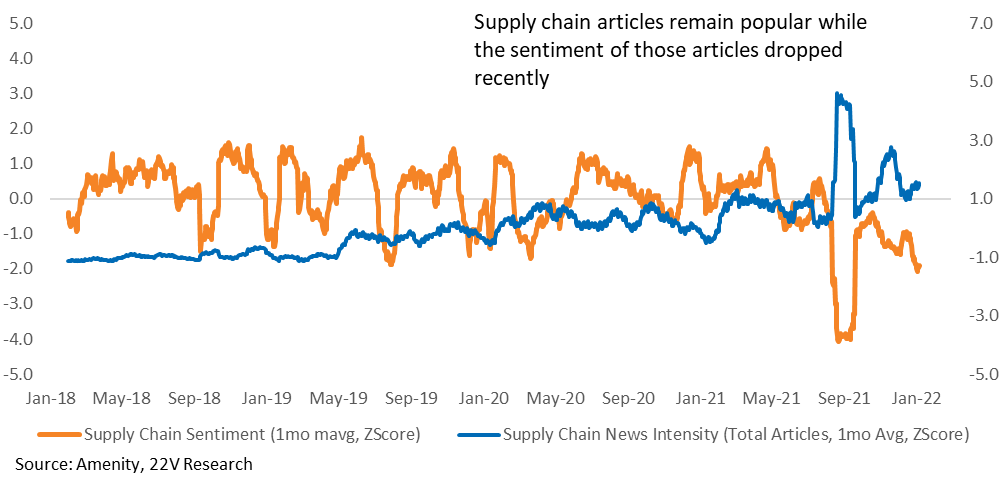
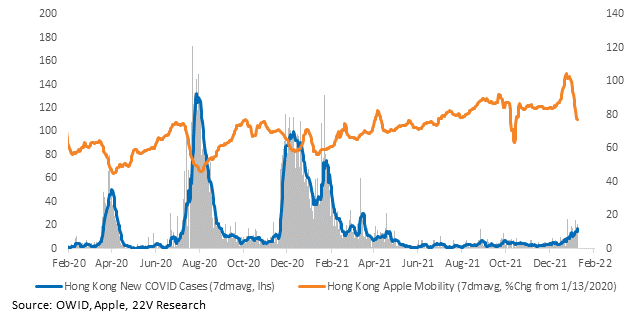
China is reporting COVID infections are spreading across the mainland. As we have been saying, the primary risk is now supply chain disruptions from an Omicron wave in Asia. Supply chain sentiment continues to deteriorate while the intensity of supply chain news rises. China is particularly concerning given its zero-COVID policy. Headlines are beginning to pop up about case growth elsewhere in Asia. Hong Kong is enacting travel restrictions, curfews, and closing venues. The positivity rate in Singapore is increasing. Omicron is surging in India.
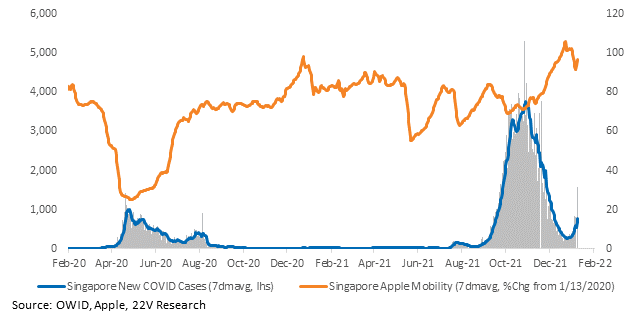
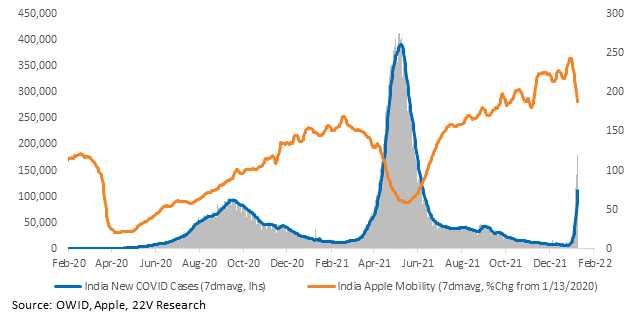
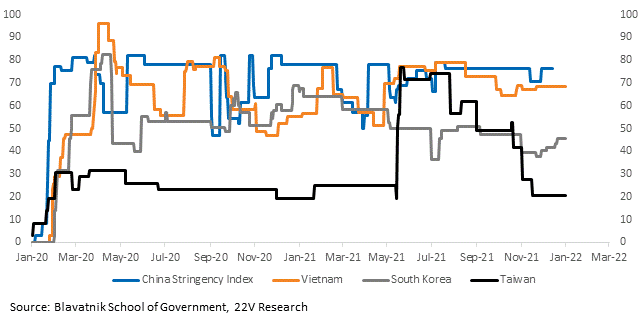
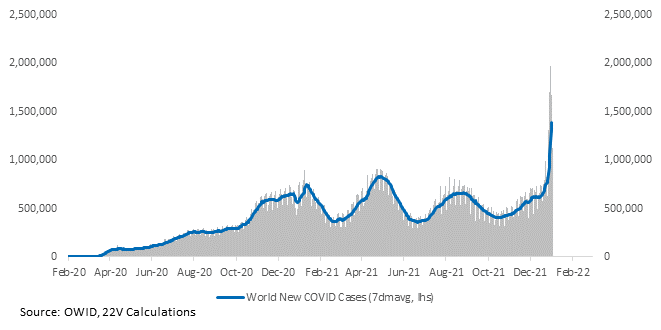
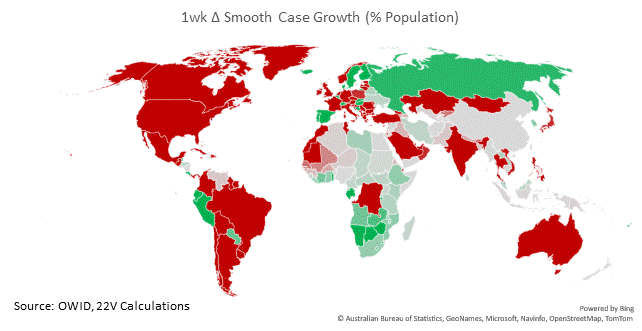
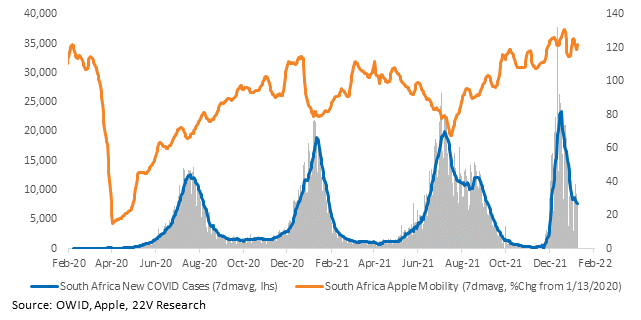
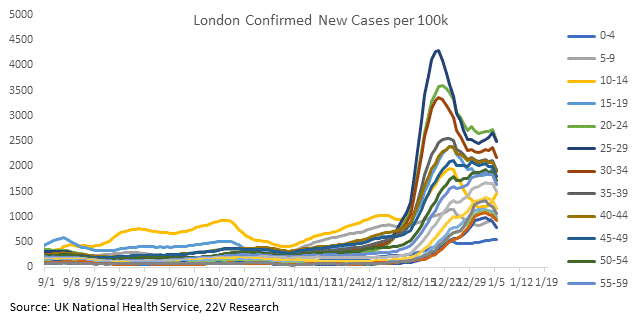
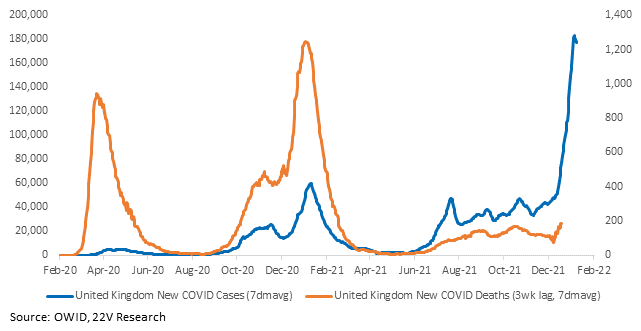
Globally, case growth is increasing almost everywhere. Southern Africa is a notable positive – the Omicron wave has burnt out where it began. Case growth in London has peaked and deaths in the UK are still low.
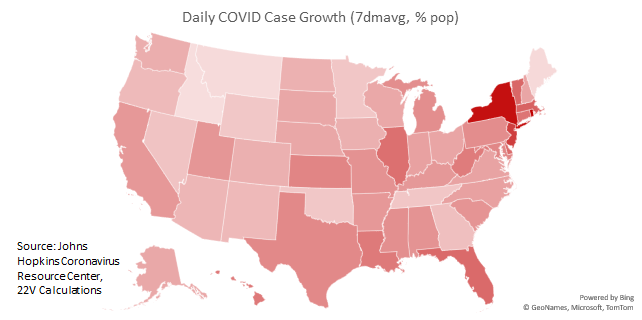
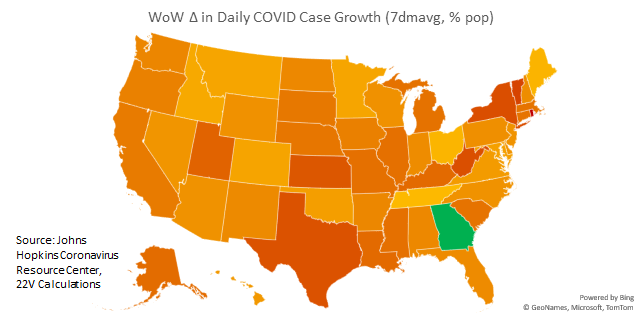
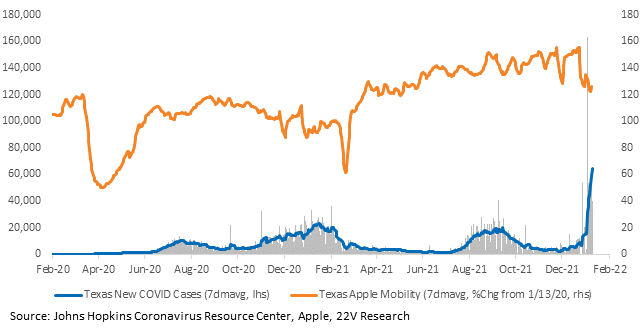
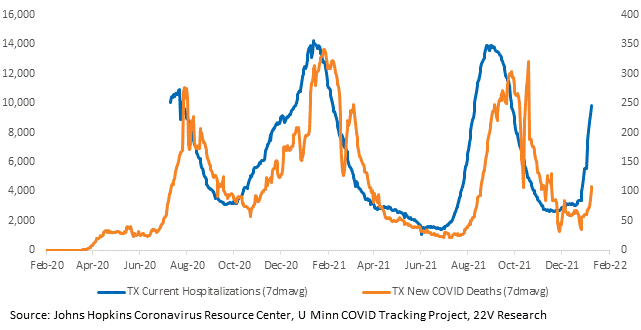
Within the U.S., case growth is higher in every state but Georgia. Case growth is still worst in New York, but California and Texas are now experiencing rapid case growth too.
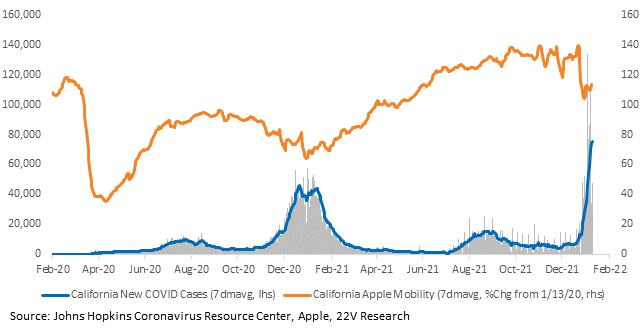
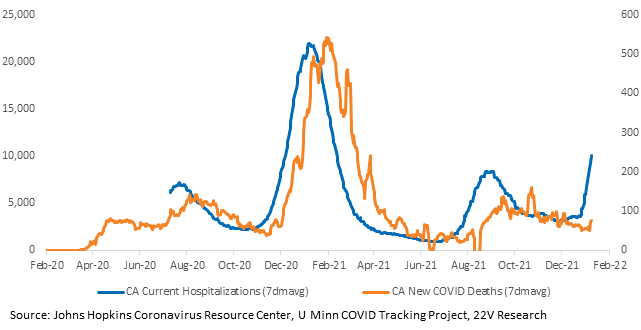
Charts for every state and country we have data for are HERE.

