
Our entire repository of COVID charts is HERE.
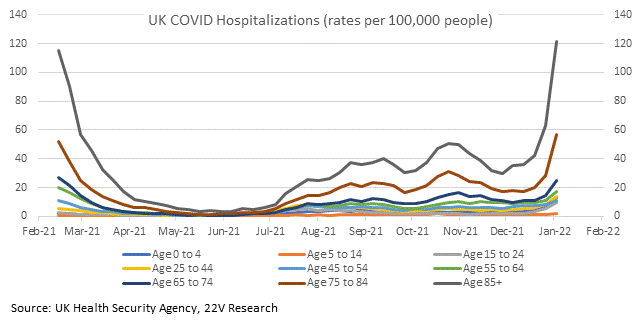
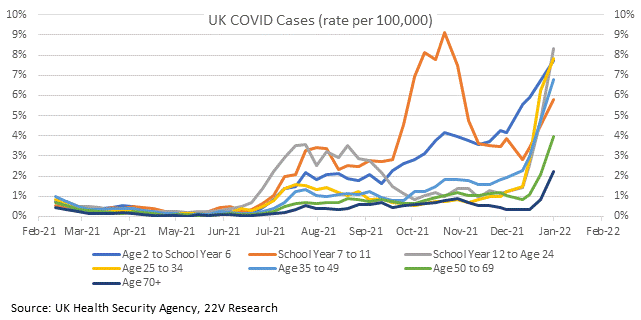
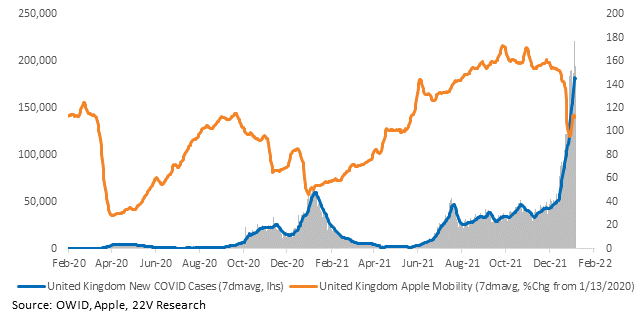
COVID hospitalization rates in the UK (through 1/2) have risen to levels last seen in February 2021, when less than 30% of the population had received one dose of a COVID vaccine. This is NOT hospitalizations per illness, but hospitalizations by population. So it does not suggest Omicron is more severe (it isn’t) but it is a poor sign for hospital capacity. And it’s a product of the rapid acceleration in case growth; case growth rates are significantly higher now than when hospitalization rates were last this high. It’s worth noting that mobility has rebounded from its recent drop despite hospitalization trends.
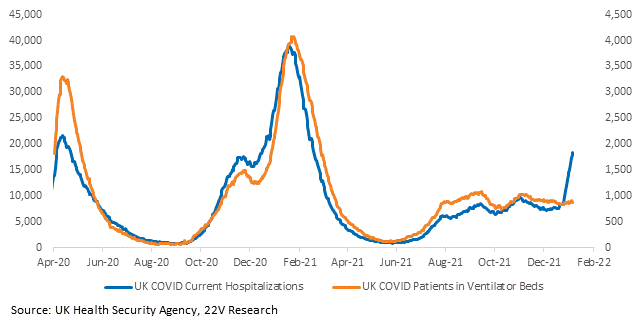
Although hospitalizations are increasing, patients in ventilator beds are not. This is a good sign for deaths. Death data over the next few weeks will be meaningful.
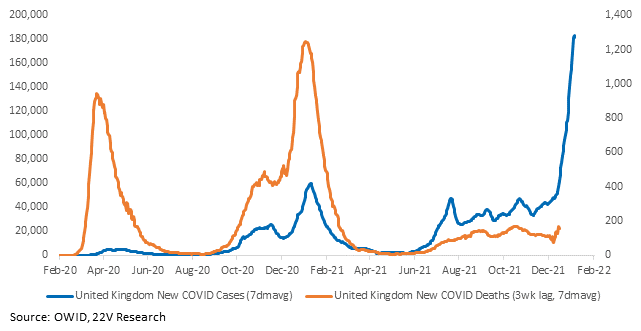
And there are early signs case growth may burn out. Case rates in London have peaked. Net net, the data still indicates the worst case scenarios are off the table given the ventilator data and early signs of case growth burning out.

Quickly on the U.S. – case growth has exceeded 500k for the fourth straight day. Hospitalizations and ICU utilization are both increasing, but net IUC admissions are lagging net hospitalizations significantly. Like in the UK, less people in the hospital are in critical condition. Also like in the UK, death data in the US over the next few weeks will be meaningful. Keep in mind new therapeutics and boosters do help preventing severe illnesses.
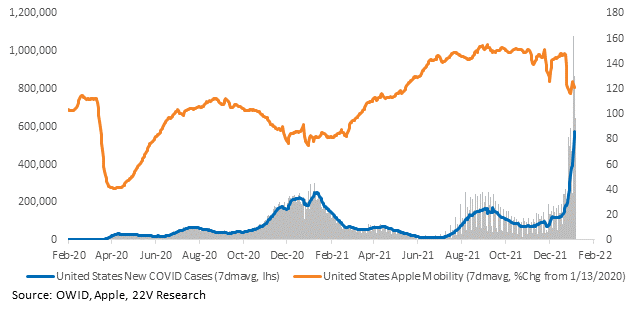
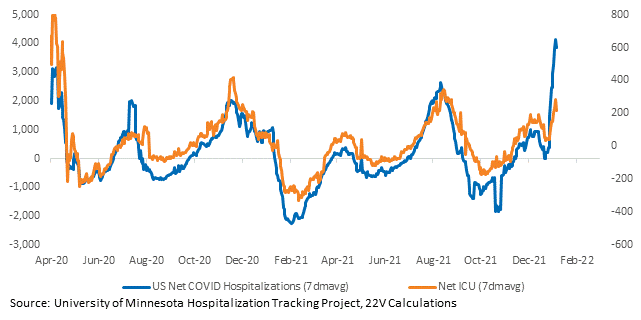
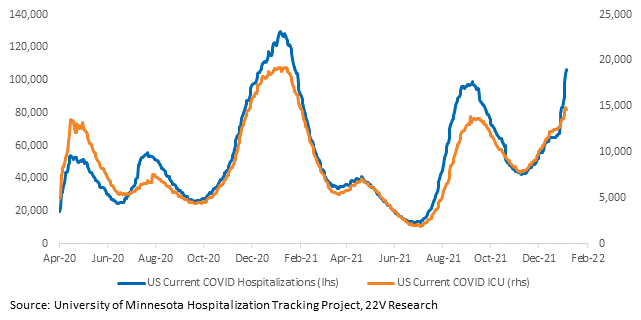
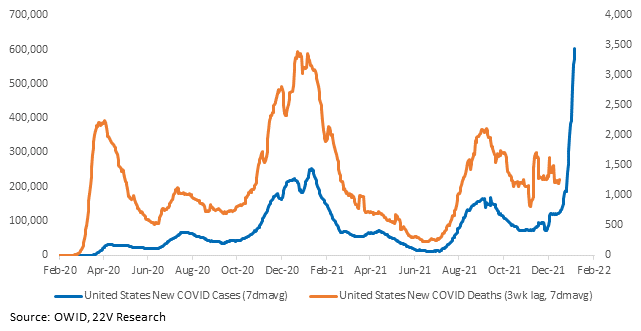
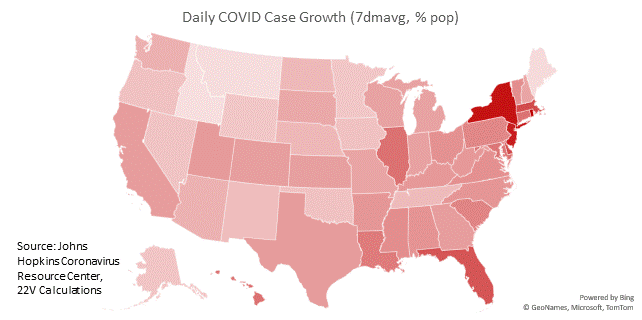
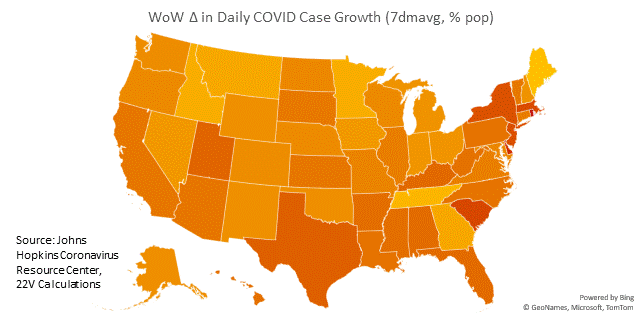
The worst case growth is still concentrated in the New York metro area, though WoW case growth is higher across all 50 states.
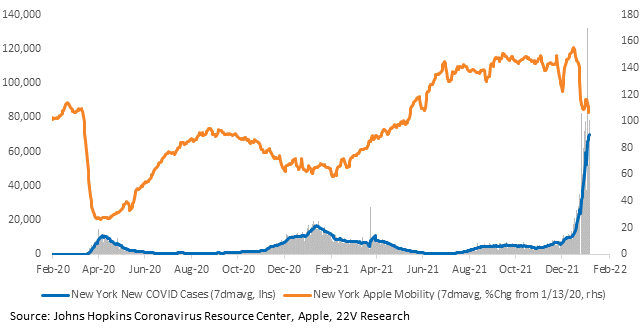
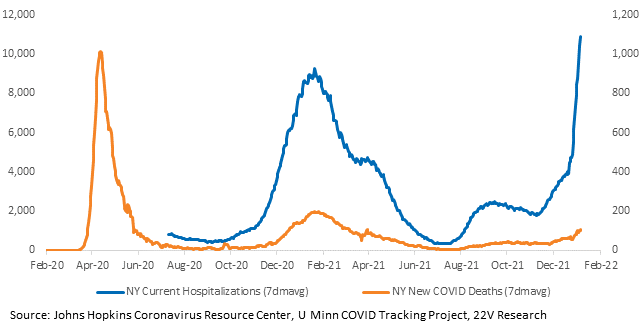
New York’s daily cases continue to climb. Hospitalizations are dramatically higher but the chart of deaths illustrates this is not 2020.
Charts for every state and country we have data for are HERE.

