
Our entire repository of COVID charts is HERE.
Holiday travel season is behind us. TSA crossings fell to -20% below 2019-levels over the holidays. However, crossings are still near post-pandemic highs despite the record surge in Omicron case growth. Flight cancellations likely did not help the TSA numbers. Airline equities have been under intense pressure since March of 2021 but outperformed the S&P by +2.7% today and have risen +7.8% relative since their low on 12/16. For sustained outperformance, investors need some assurance that Omicron won’t cause travel restrictions, reduce demand even without restrictions, or wreak labor havoc. TSA crossings will give us a sense of demand.
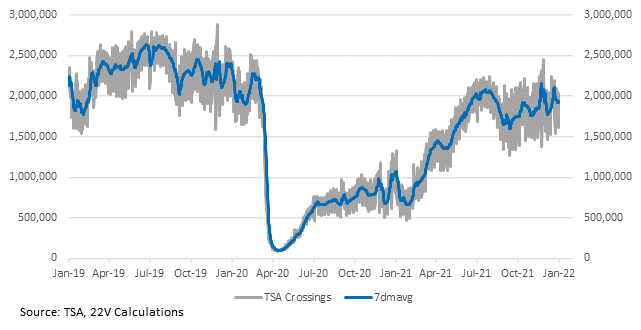
If Omicron fears fade, Airlines relative performance might have some catching up to do relative to TSA crossings.

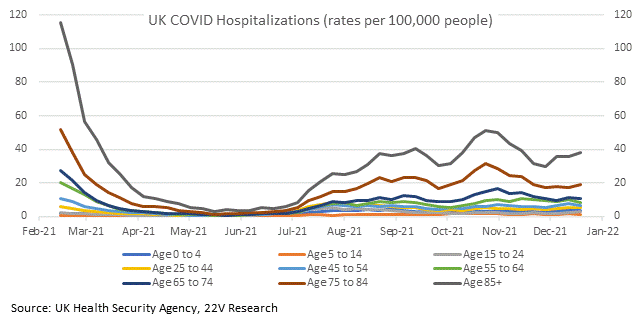
There is another holiday data lag for the New Year, but now we have detailed UK data through 12/29. Case growth rates and totals have moved up age demographics, including the elderly. So far though, hospitalization rates – which we have data for through 12/23 – are still down from the Delta wave and significantly below the pre-vaccine, early-2021 wave. The breadth of early data has indicated Omicron severity is much lower. More data from the UK has not changed the narrative.
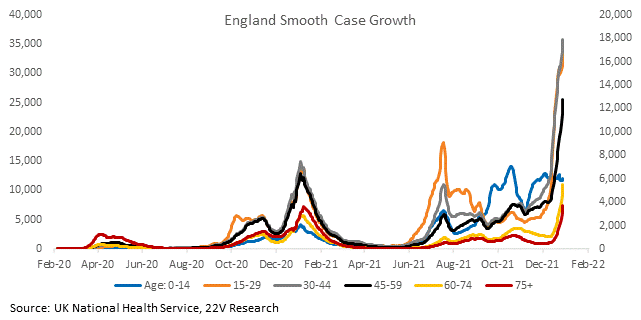
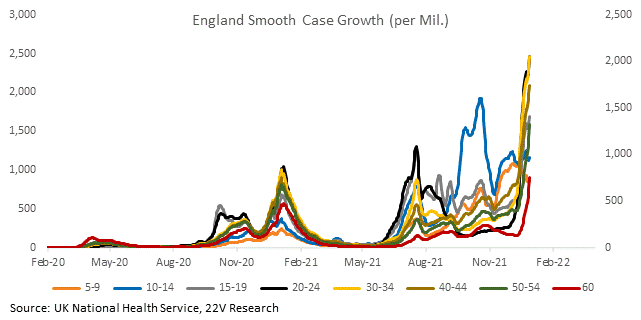
Case growth continues to accelerate rapidly. We are approaching the 3-week lag for deaths in the UK. The ratio of cases to deaths will be meaningful over the coming weeks.
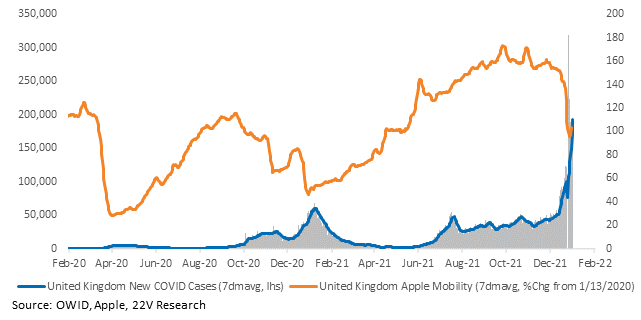
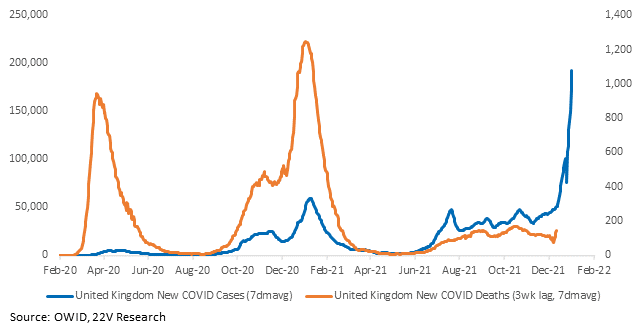
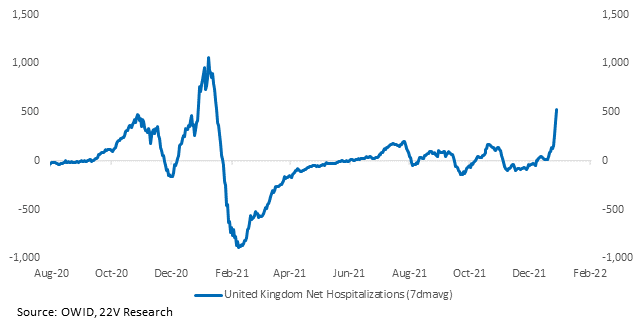
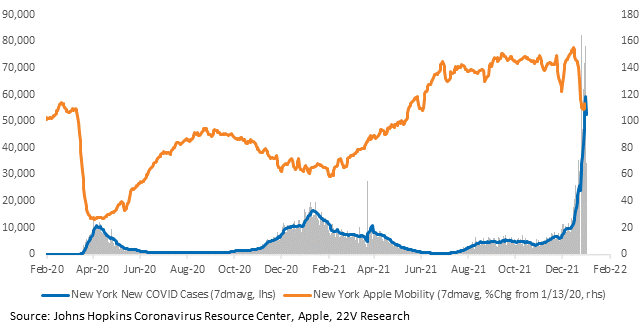
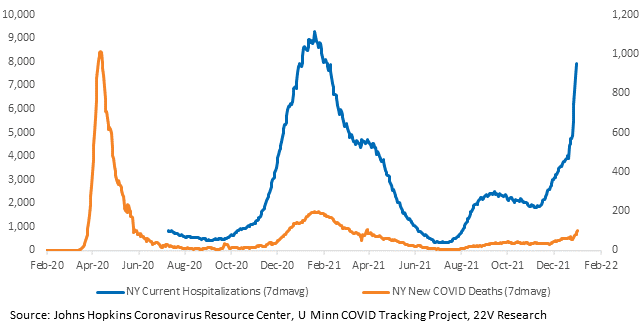
Case growth is similarly accelerating in the US. Hospitalizations and ICU capacity utilization are both increasing. The number of people in the ICU is at the peak level hit in the Delta wave BUT activity was elevated during the Delta wave. So, that level is not particularly meaningful, especially considering current record case growth. No state is at record ICU levels individually. Omicron severity data, new therapeutics, and new booster data all indicate the worst-case scenarios are off the table, despite case growth. It’s unlikely Omicron will be a significant demand shock. U.S. death data does not yet reflect the Omicron wave given its typical lag, but the data starting this week will.
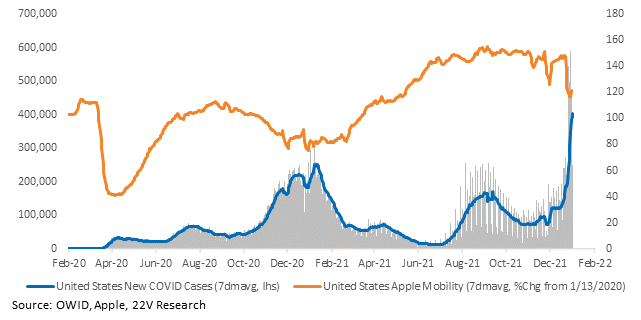
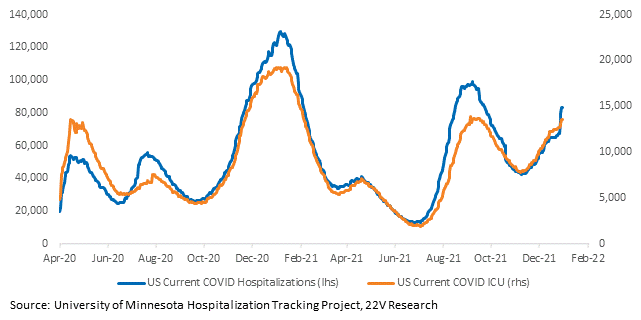
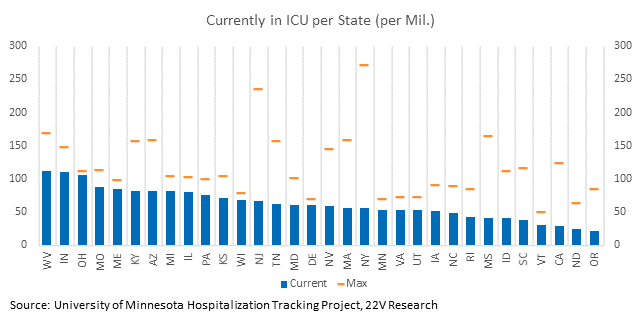
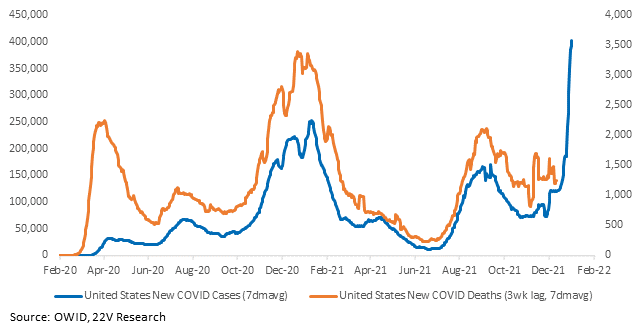
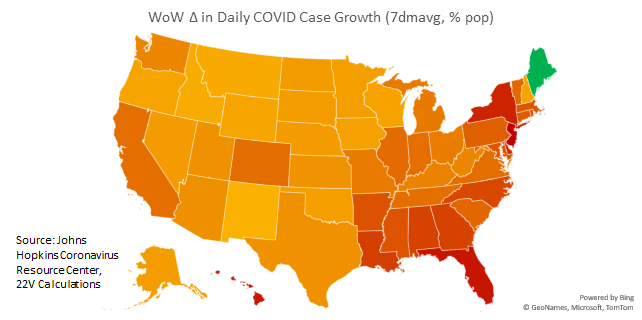
Case growth is increasing the fastest across the Northeast and Southeast.
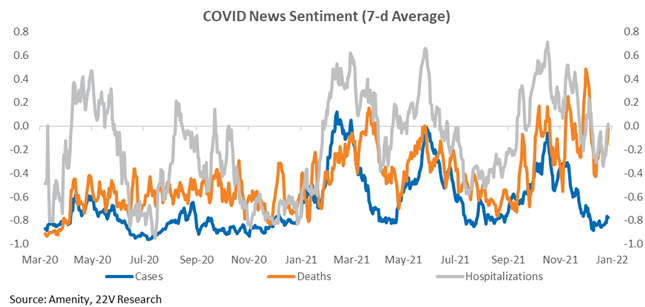
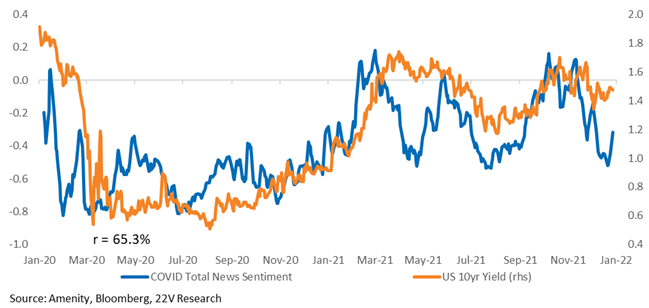
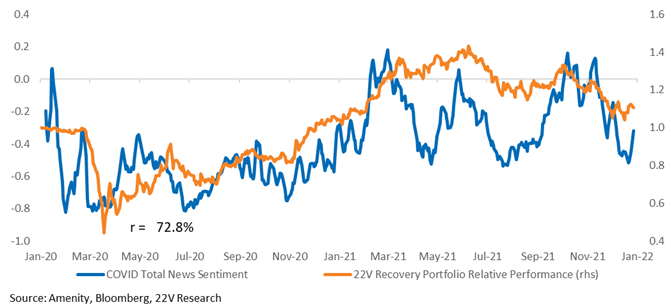
COVID news sentiment, particularly concerning severe disease, is improving. Better sentiment alleviates a significant headwind to 10yr yields and to our Recovery Portfolio.
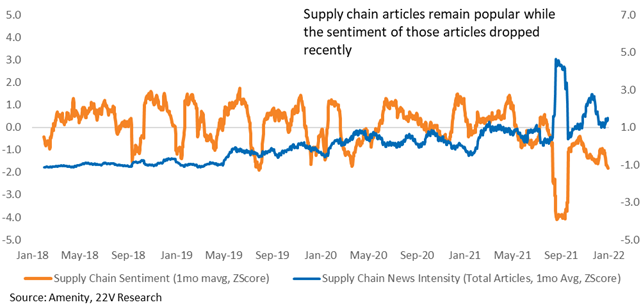
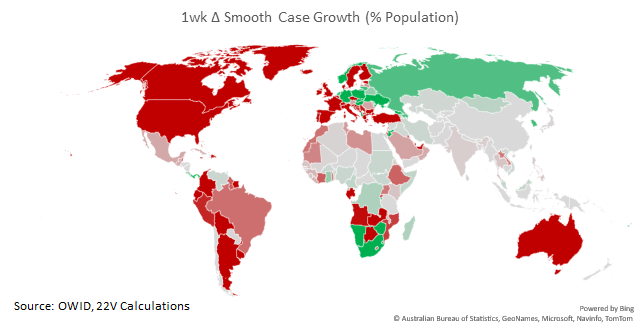
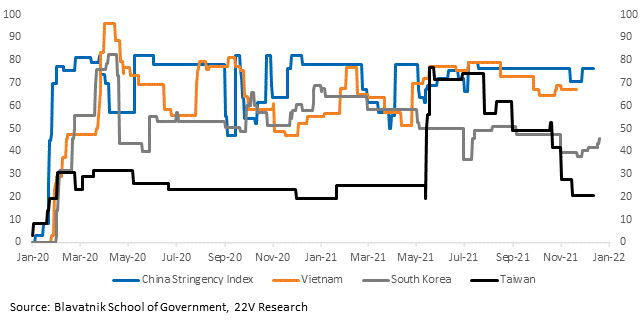
The primary risk, as long as estimates of severity are roughly accurate, is now whether an Omicron outbreak in Asia disrupts supply chains. How countries respond to Omicron will have an important impact on supply chain issues near term, but there is not yet enough data to determine which way that will break. China’s zero-COVID policy appears to be in full effect. Supply chain sentiment is deteriorating while the intensity of supply chain news is increasing. Case growth in Asia ex-China is, for now, tame. We are monitoring Oxford’s stringency indices to track the level of restrictions. China and Vietnam are both have elevated COVID restrictions while South Korean and Taiwan do not.
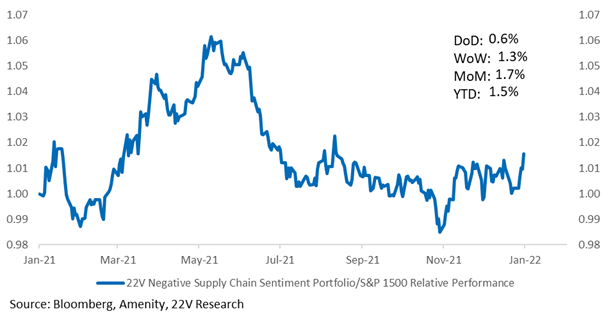
However, stocks with the worst supply chain sentiment have outperformed recently despite worsening news sentiment. Investors are getting more comfortable with the supply chain outlook, likely aided by better Omicron severity sentiment. Worst-case scenarios are off the table, which should imply less stringent lockdowns. FYI our friend Noah Smith held an insightful interview with Ryan Petersen, founder and CEO of Flexport, a supply chain software company, on bottlenecks. Check it out HERE.
Charts for every state and country we have data for are HERE.

