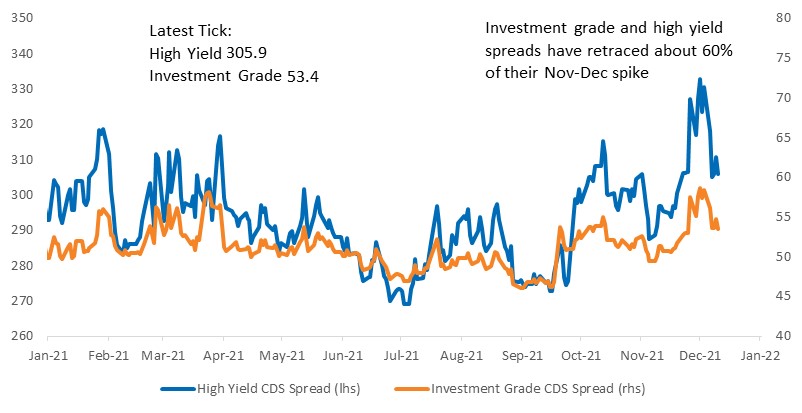
SUMMARY: Equity market volatility has moved lower and the S&P is up more than 3% w/w. Financial conditions in general have eased with investment grade and high yield spreads retracing nearly 60% of their November to early December spike. Omicron remains a headwind, but the overall market backdrop has become incrementally supportive of risk.
Implied vol has declined rapidly, and the VIX curve has reversed its late November inversion. At the same time, though up on a short-term basis, smoothed market correlation remains low. And the first PC of the S&P, a rough proxy for macro risk, has moved lower. All of the above leaves a higher volatility, lower correlations more idiosyncratic market, where growth is still strong.
At the same time macro influence is waning and idiosyncratic risks are waxing. Earnings sentiment, measured by running the Amenity natural language processing tool on 3Q earnings call transcripts, showed a meaningful deterioration in sentiment. Earnings and business sentiment trends are not consistent across industry groups and focusing on relatively strong earnings sentiment industries should be accretive as earnings risk creeps higher over the coming quarters.
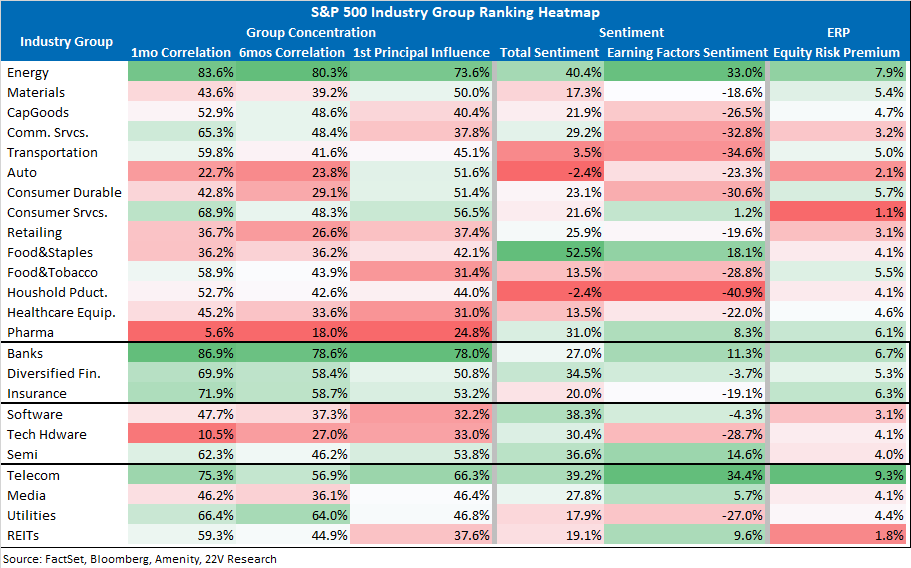
In a less macro environment where micro trends are providing some persistent tailwinds (Energy, Semis and Autos have all outperformed the broad market by more than 20pp), it is important to separate out trend-susceptible groups from places with more idiosyncratic opportunities. Below we break down where industry group correlation, sentiment, and valuations fall. Industry groups with high correlations and higher 1st principle component contributions are more likely to exhibit group trends. Those with strong sentiment and higher equity risk premiums have more attractive fundamental backdrops. Lower correlation industry groups with more mixed sentiment and valuation are where we would look for single names that stand out.

Industry Group Screening Tools: Equity market volatility has moved lower and the S&P is up more than 3% w/w. Financial conditions in general have eased with investment grade and high yield spreads retracing nearly 60% of their November to early December spike. Omicron remains a headwind for specific industry groups and our recovery portfolio has underperformed over the past few days. But the overall market backdrop has become incrementally supportive of risk.
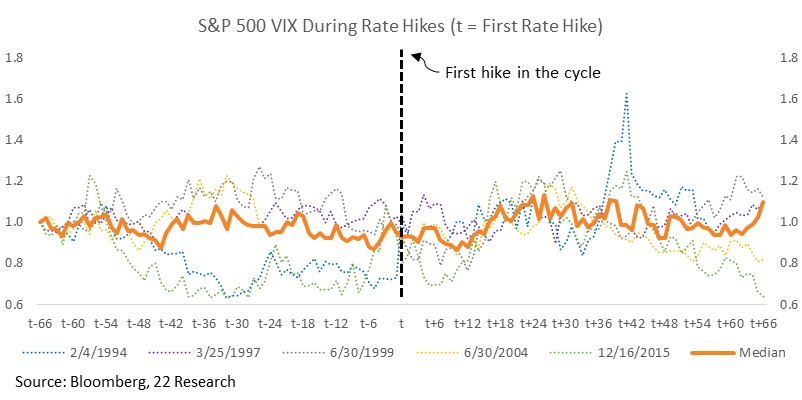
Implied vol has declined rapidly and the VIX curve has reversed its late November inversion. Near-term uncertainty has declined meaningfully. However, the absolute level of implied vol is well above its post-GFC level. Easing of Omicron risks would help push implied volatility and historically implied vol has been flat leading into rate hikes, but a return to post-GFC VIX levels is unlikely given the growth and inflation backdrop.
At the same time, though up on a short-term basis, smoothed market correlation remains low.
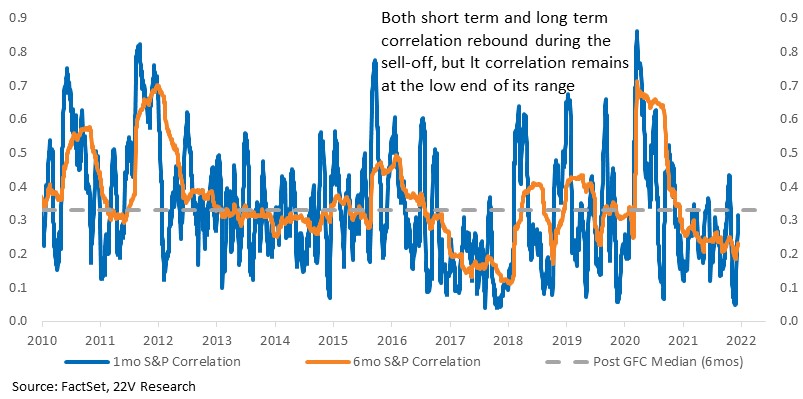
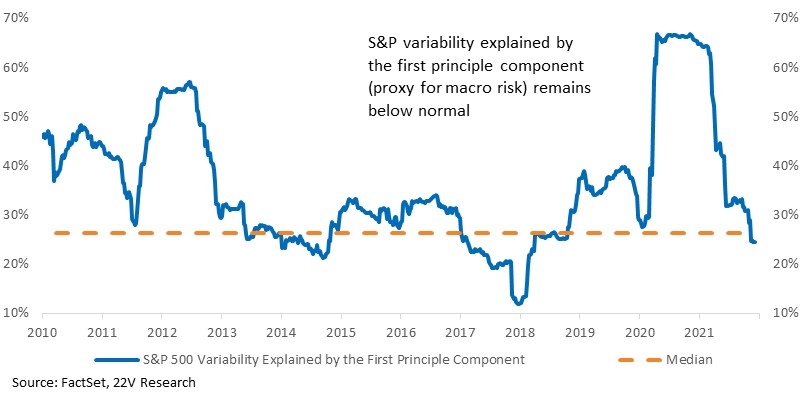
Lower correlations are consistent with ongoing low level of S&P volatility explained by the first principle component of the market. The first PCA is a rough proxy for macro risk and even as inflation and Omicron concerns have increased, equities have been trading on a more idiosyncratic basis.
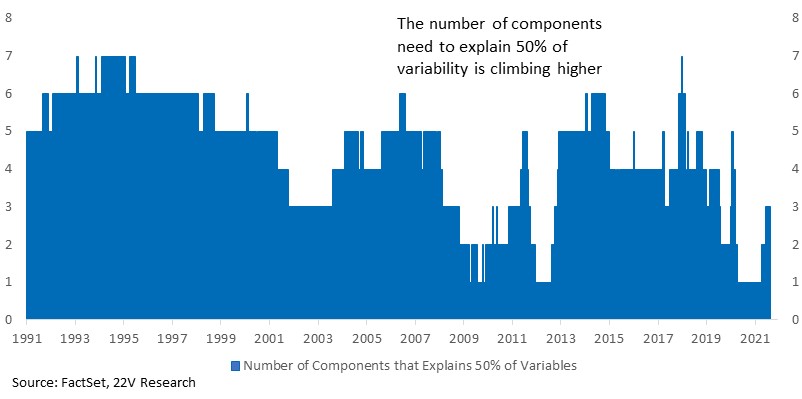
Looking further into PCA, the number of components needed to explain 50% of S&P variability has been moving higher, but still has room to increase further as the economic backdrop returns to a pre-pandemic level. Further still if we move back to a pre-GFC level.
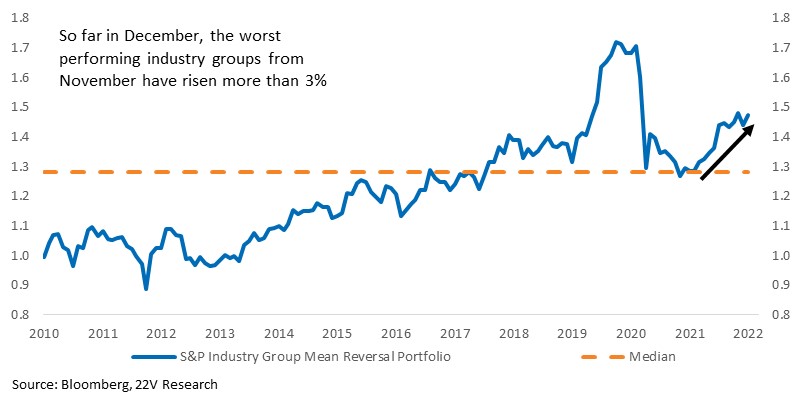
All of the above leaves a higher volatility, lower correlations, more idiosyncratic market, where growth is still strong. That helps explain the persistence of industry group mean reversal over the course of the year. So far in December, the worst performing industry groups in November (Telecom, Banks, Healthcare, Energy, Insurance and Staples) have gained 3.6%. The best performers from last month (Semis, Hardware, Retailing, Autos, Durables and Household Products) have also gained, but just 1.2%.
SCREENING MICRO THEMES: At the same time macro influence in waning and idiosyncratic risks are waxing. Earnings sentiment, measured by running the Amenity natural language processing tool on 3Q earnings call transcripts, showed a meaningful deterioration in sentiment. Overall business sentiment remains elevated, and as noted in other 22V research (Gerard’s here, strategy here), margins are likely to surprise to the upside in 4Q and in 1H22, but the outlook gets murkier beyond that.
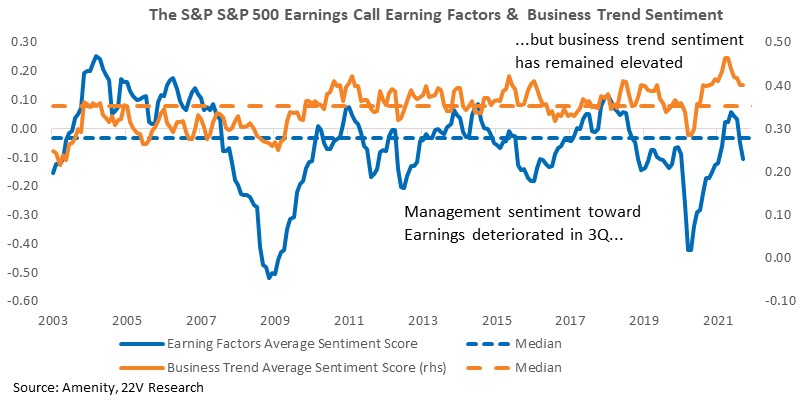
Earnings and business sentiment trends are no consistent across industry groups. Though the blind mean reversion strategy has worked well in the current backdrop, focusing on relatively strong earnings sentiment industries should be accretive as earnings risk creeps higher over the coming quarters. Last reporting season, firms that missed earnings were harshly punished and as we highlighted here, companies with strong earnings sentiment tend to outperform.
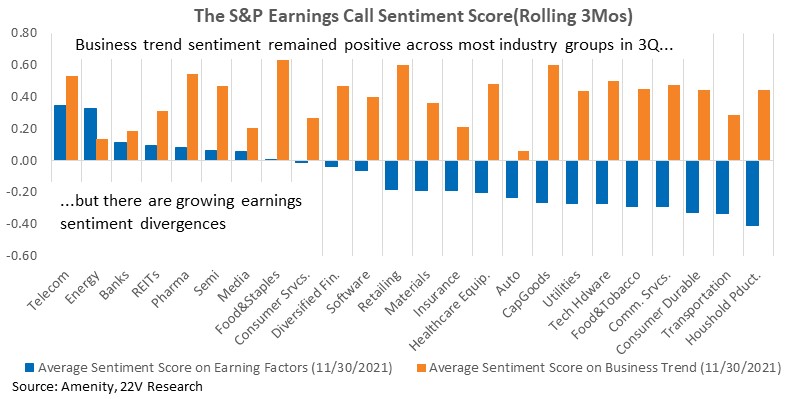
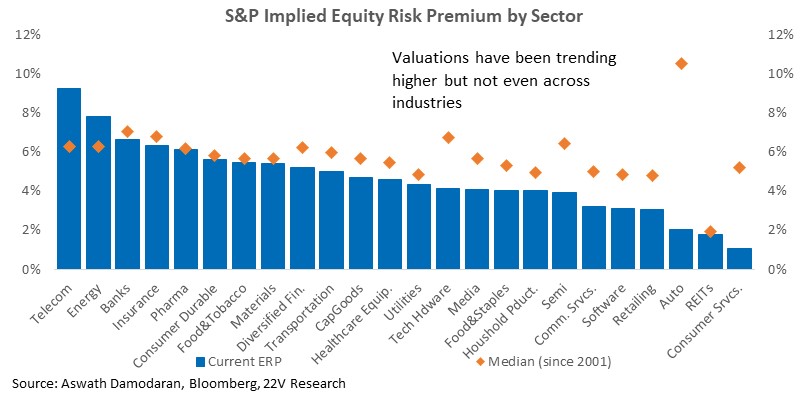
At the same time earnings risk and reward has increased, valuations are elevated across sections of the market. Below we map out the absolute equity risk premiums (our preferred valuation metric) across industry groups. Valuations remains attractive (higher EPR ~= low PE) in Telecom, Energy, Banks, etc. and elevated in Autos, Software, Retail.
To help with screening as in this evolving backdrop built a quick industry heat map showing
The idea of this heat map is to screen quickly for industries that have high potential for micro trends (high correlation, larger macro influence), and which ones have the most attractive fundamental backdrops (high sentiment, higher ERPs). It is also a quick way of looking for industries that offer higher stock specific potential. REITS, Pharma, Software tend to have lower correlations (more potential for stock specific deviations within groups). RETS in particular also have strong sentiment scores though their ERPs are less attractive.