Our entire repository of COVID charts is HERE.
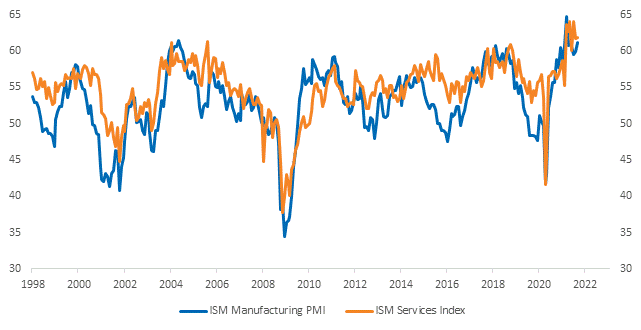
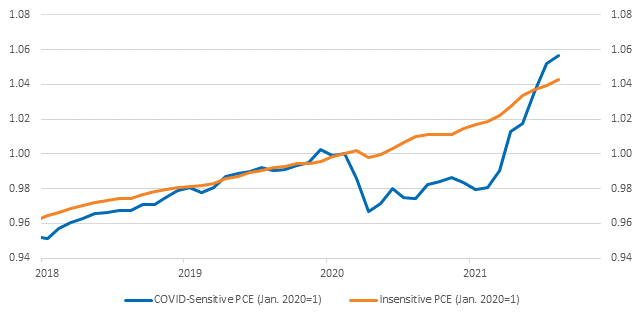
Today the Service ISM for September beat, unexpectedly rising from 61.7 to 61.9. Consensus estimates on Bloomberg were for 59.9. The beat reinforces a point we have been trying to make – if people can’t spend money on goods because of supply bottlenecks the money won’t disappear. People can spend money on services instead. PCE data, although more delayed, indicates that’s exactly what is happening. COVID-sensitive PCE (services) has been outpacing insensitive PCE (goods). Service spending favors our reopening basket (check that out here).
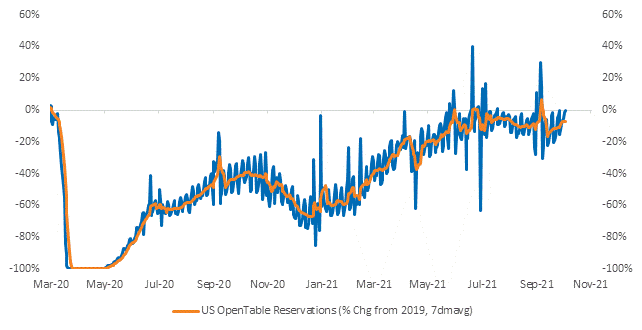
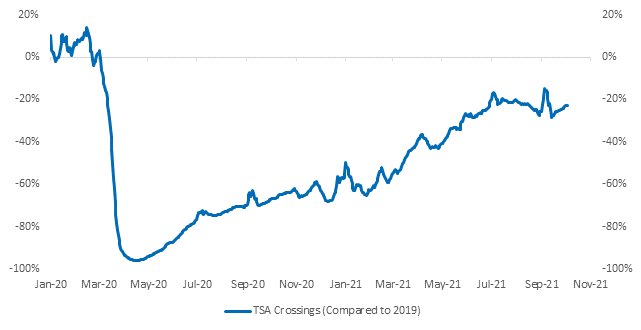
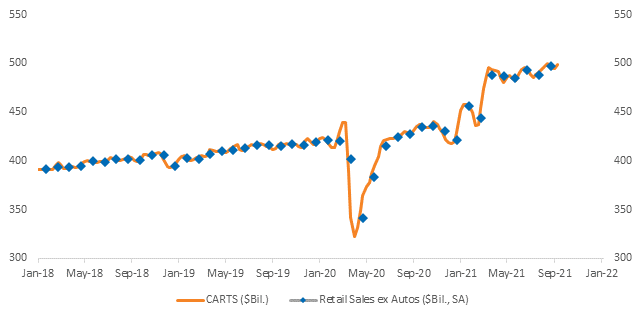
We have a number of alternative data sources that are timelier. OpenTable data suggests service demand is expanding. TSA crossings are still down -20% compared to 2019, but there are more travelers than a month ago. Google’s mobility data is robust (including the retail and recreation subset). And the Chicago Fed’s CARTS index, which is a composite of high frequency data designed to match up with monthly retail sales data, reports weekly retail trade increased +0.8% from September 7-14 after decreasing -0.3% September 1-7. All of these together point to a mix shift in spending rather than disappearing (or delayed) consumption.
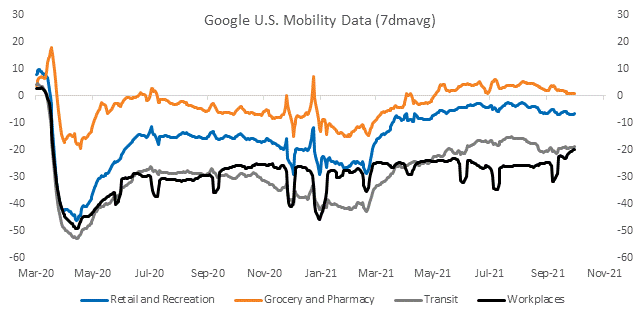
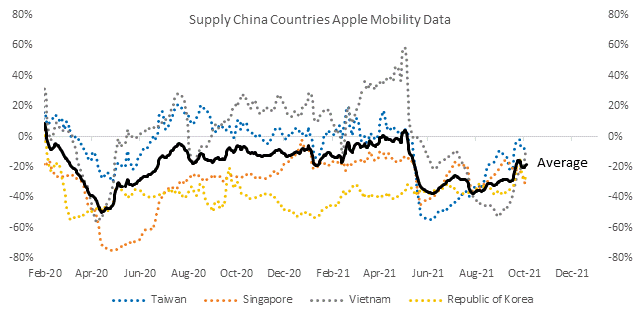
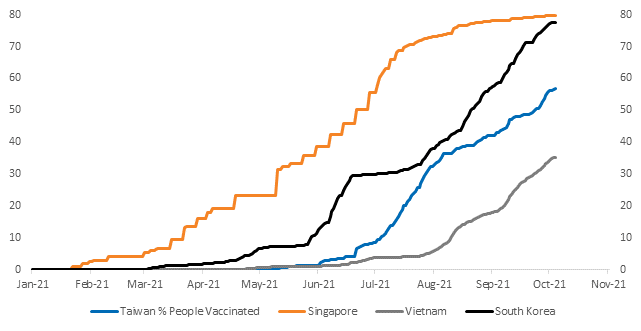
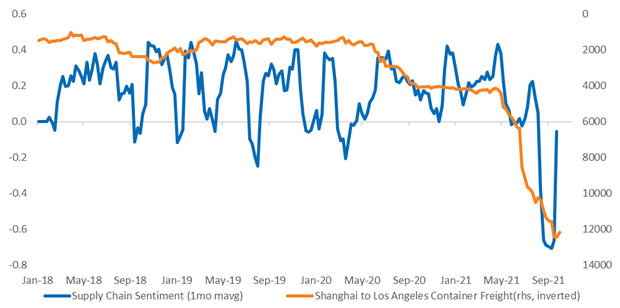
Supply chain disruptions are a hindrance to certain goods specifically. Case growth is declining in Vietnam, never picked up in Taiwan, and is relatively low in South Korea. Case growth has increased in Singapore, but Singapore has a ~80% vaccination rate. Mobility is slowly recovering across the region. Supply chain sentiment, measured using natural language processing applied to supply chain news, has rebounded significantly too. Hopefully, that is a precursor to a decline in freight rates.
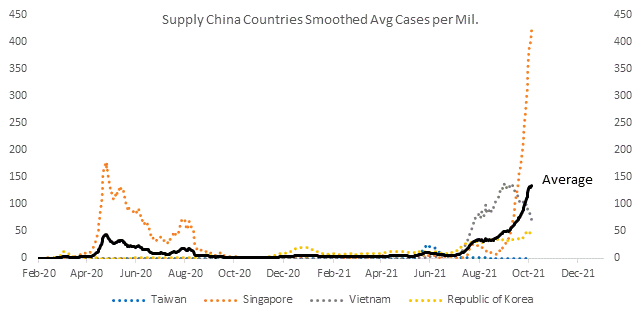
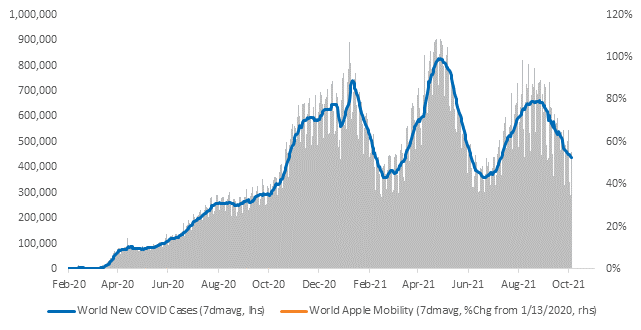
Global COVID case growth is lower and declining.
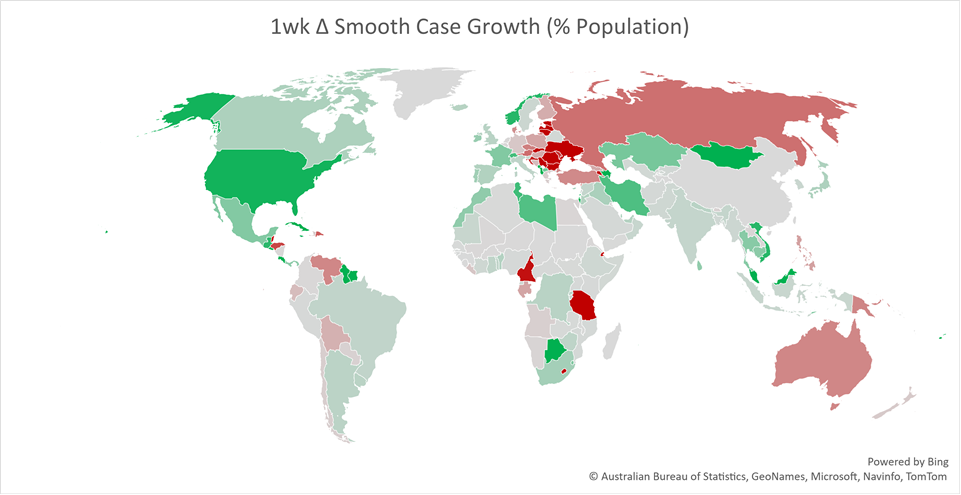
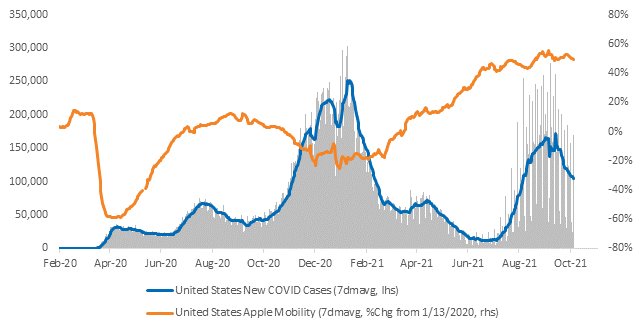
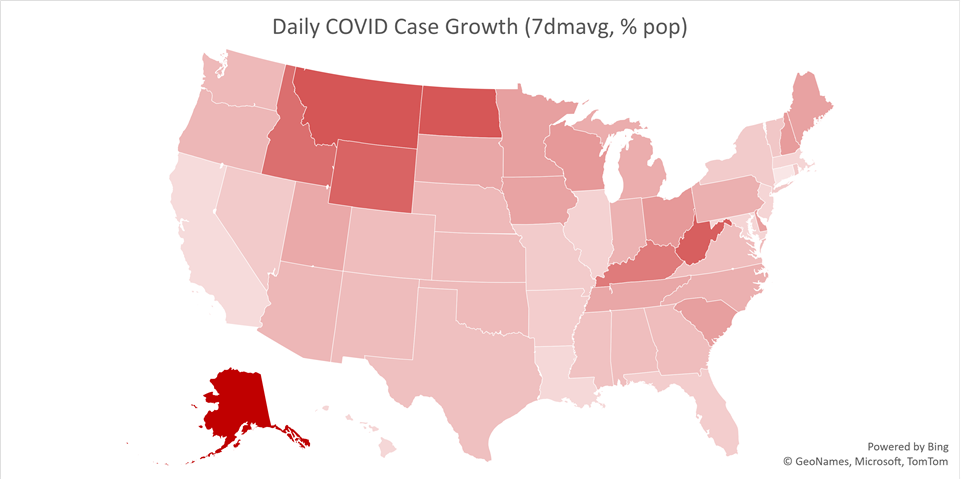
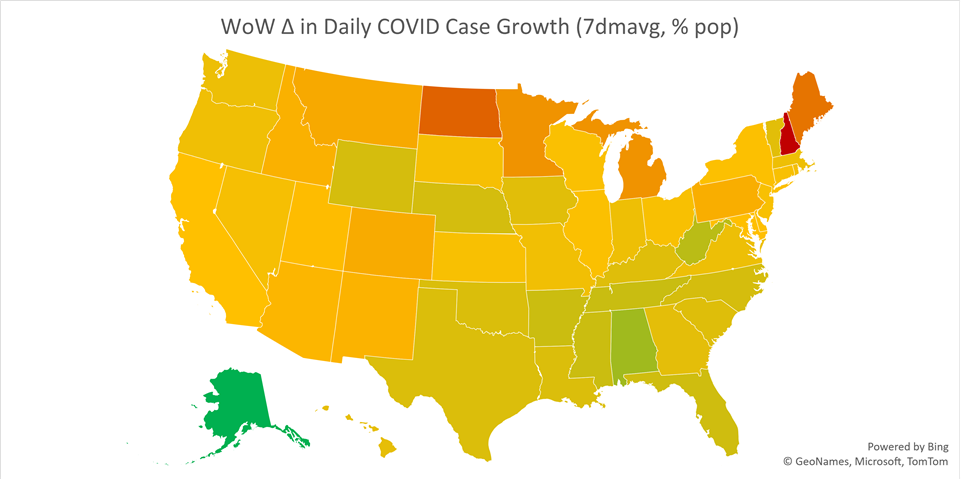
Case growth in the United States is lower as well. The worst pockets of case growth as a percent of the state population are in the Mountain West, where there aren’t a lot of people, and in parts of the Southeast, which have had good WoW declines in case growth. Charts detailing each state (and country) are HERE.