Of Bear Markets, Commodities, and Yields
It’s been, and will continue to be, a maelstrom of data, news, rumors, and inconvenient truths. What follows may not be pleasant, but it seems important to review.
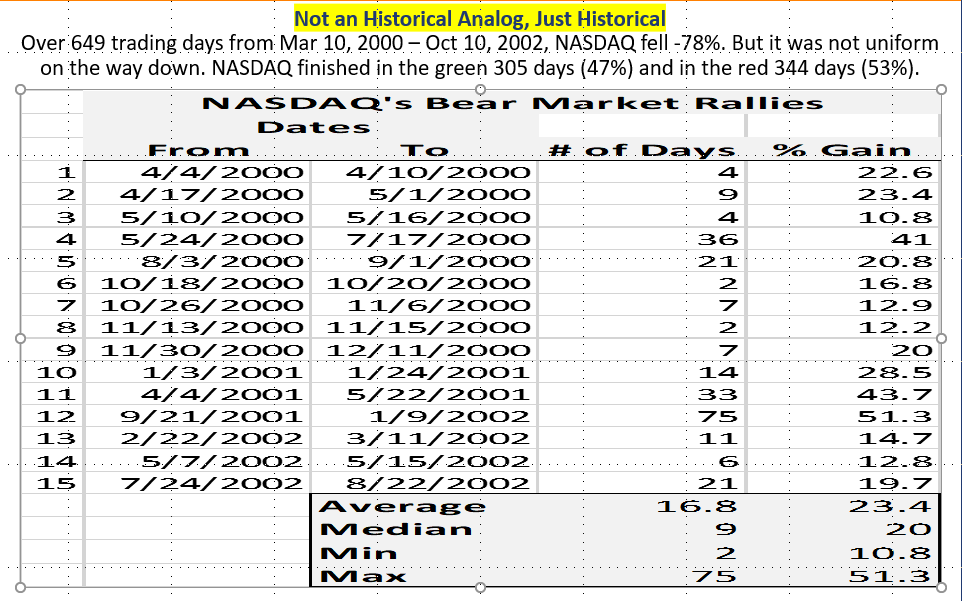
A – Equities were in a bear market before the Russia / Ukraine situation and, we believe, equities are still in a bear market. It’s our experience that the biggest, sharpest, and most impetuous rallies happen within the confines of a bear market often driven by something that was said or as is often the case, something that was believed to be said. We remember during the NASDAQ bear market from March 2000 – September 2001 that John Chambers, the then Chairman of Cisco (CSCO), made some public comments and NASDAQ broad-jumped higher on the news. We then wondered in a client note / report, “Is John Chambers going to part the Red Sea next?” We’ve been showing the table below in our 22V Friday Webinars for a few months now and think it’s appropriate to include here if, for no other reason, then to remind us that, “…and there is no new thing under the sun.” (Ecclesiastes 1:9-10)
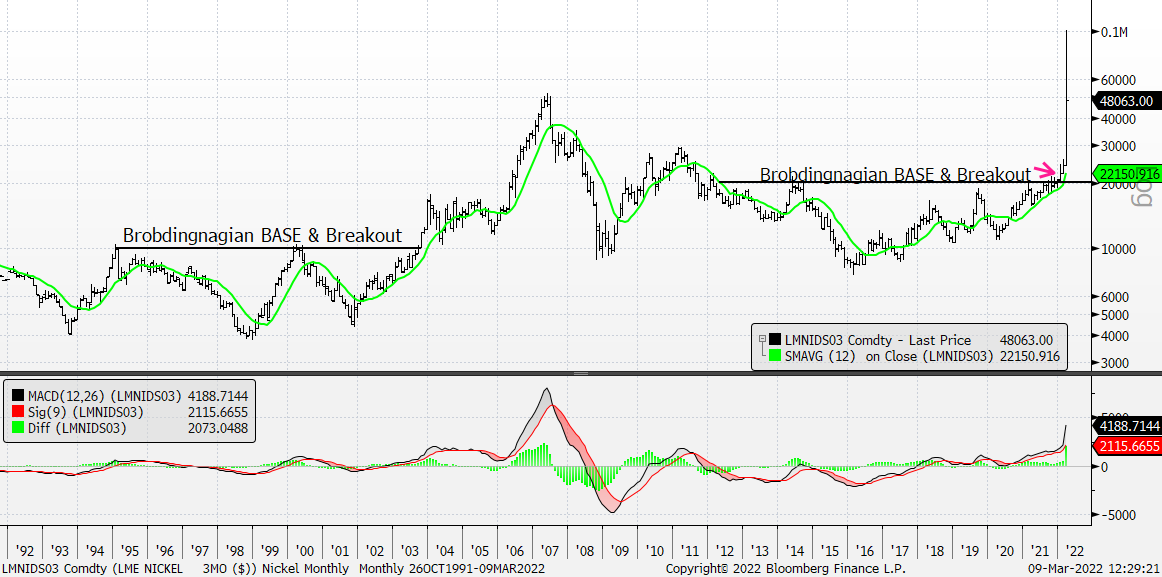
B – In our Sunday evening note, “Mercy, Mercy Me” we said, “During COVID many became arm-chair epidemiologists. In the last few weeks many are now offering insight into the Russia / Ukraine conflict. How long before everyone is a commodity expert?” Well, it’s happened. There’s lots of commodity talk coming now where blame is being placed on Putin and Russia for the sharp commodity moves. We are not apologizing nor defending the actions of Russia, but the commodity bull market began with gold’s breakout in the summer of 2019 and then a breakout for the Spot Index in the autumn of 2020. Too, while the 250% two-day rise in Nickel was unprecedented and smacked of margin calls against unprofitable short positions resulting in a massive squeeze the metal had already rallied on tight supplies. We’d been showing its Brobdingnagian BASE for months in our webinars and noted its Breakout in January 2022.
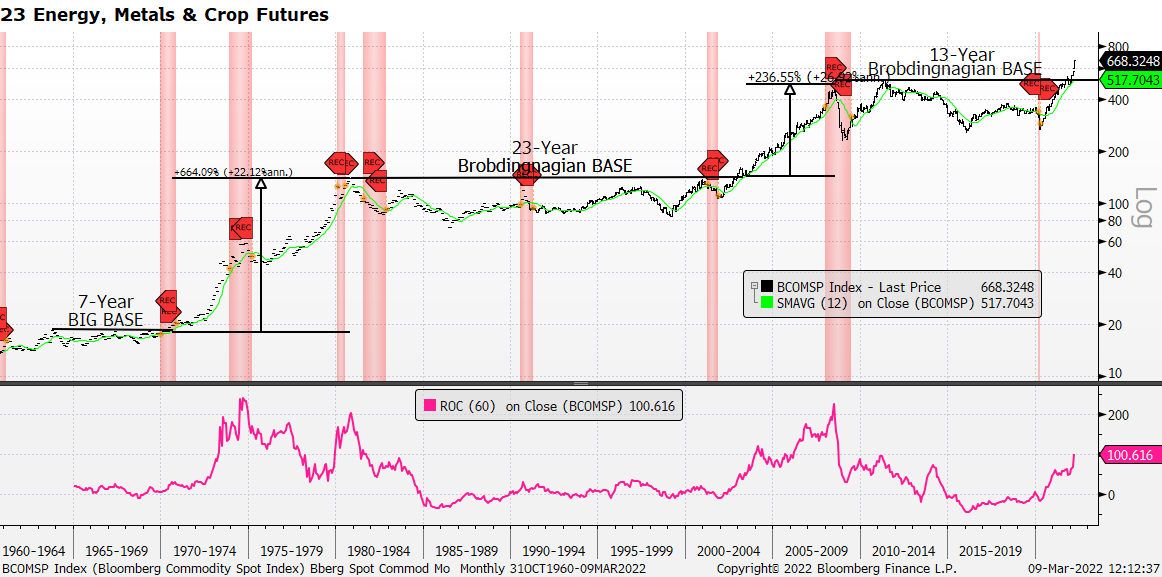
 Today’s retrenchment on the commodity front is eye-opening with prices down sharply across the board, but before today it had been a commodity rout on the upside. Over the prior 10 days the Bloomberg Commodity Spot Index had added 19% (!) and since December 20, 2021, it had gained 38% so a pullback is understandable and likely overdue. But this pullback is a pullback in a bull market and should be used to add to existing positions. The monthly chart below for the Bloomberg Commodity Spot Index is as good a set-up – 13-Year Brobdingnagian BASE & Breakout – as we have in our roster of charts and while historical cycles are few and presenting the cycle data in Stats class might result in a poor grade, presenting the cycle data in portfolio management class might just get you on the Dean’s List. Prior up cycles post a breakout have been long-lived and provided big gains.
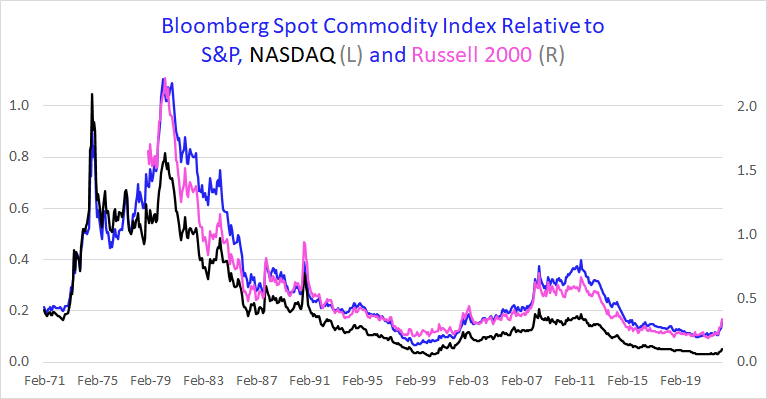
An equally important chart shows relative ratios for the Bloomberg Commodity Spot Index / S&P, NASDAQ, and R2000. Turns higher, in favor of the Commodity Index, look to still be in the very early stages.
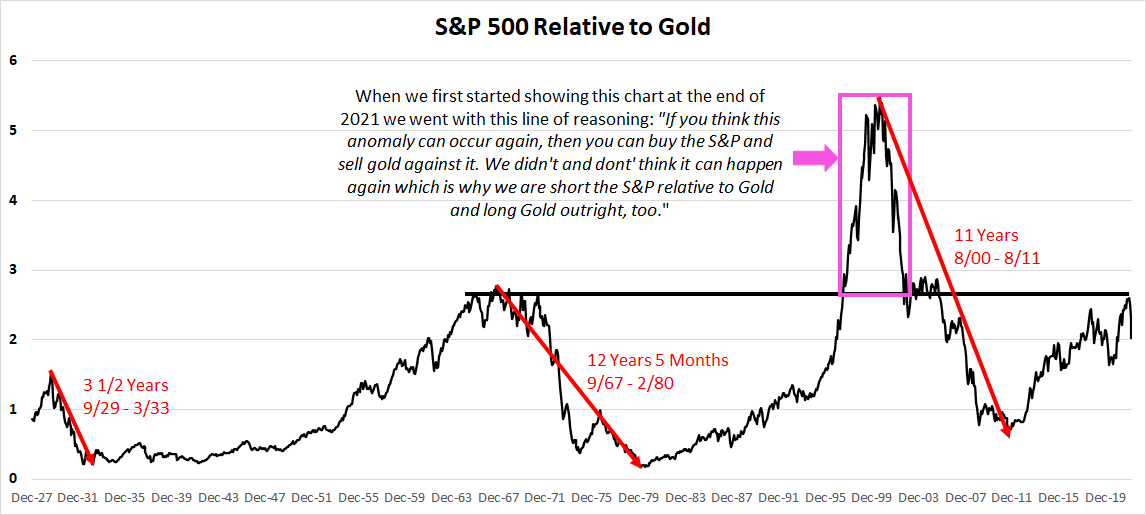
And here’s another important chart which we’ve dubbed, “The Fight of the Century.”
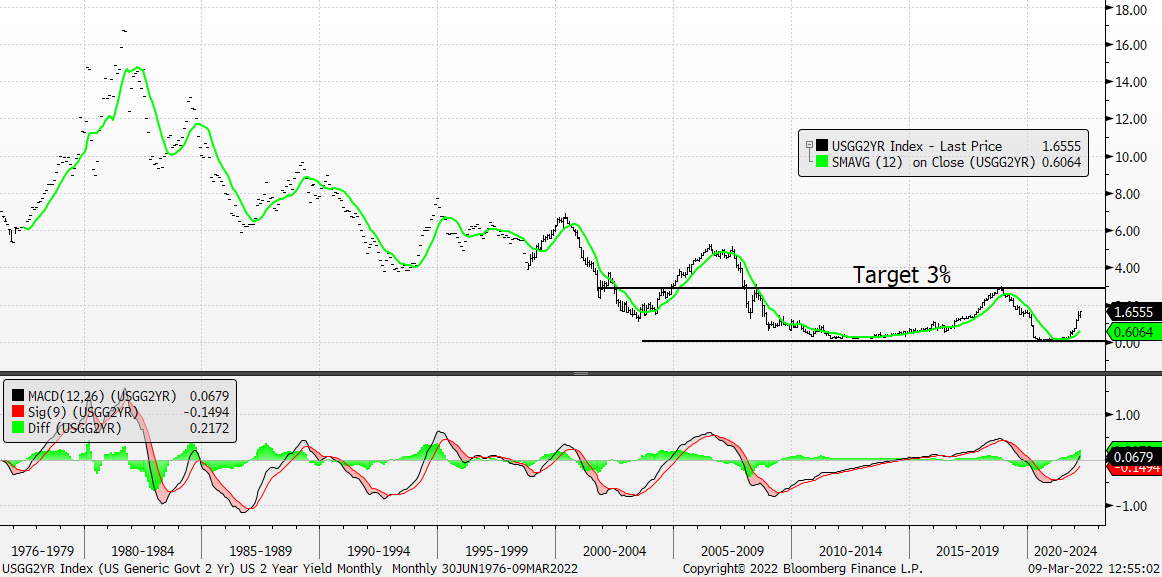
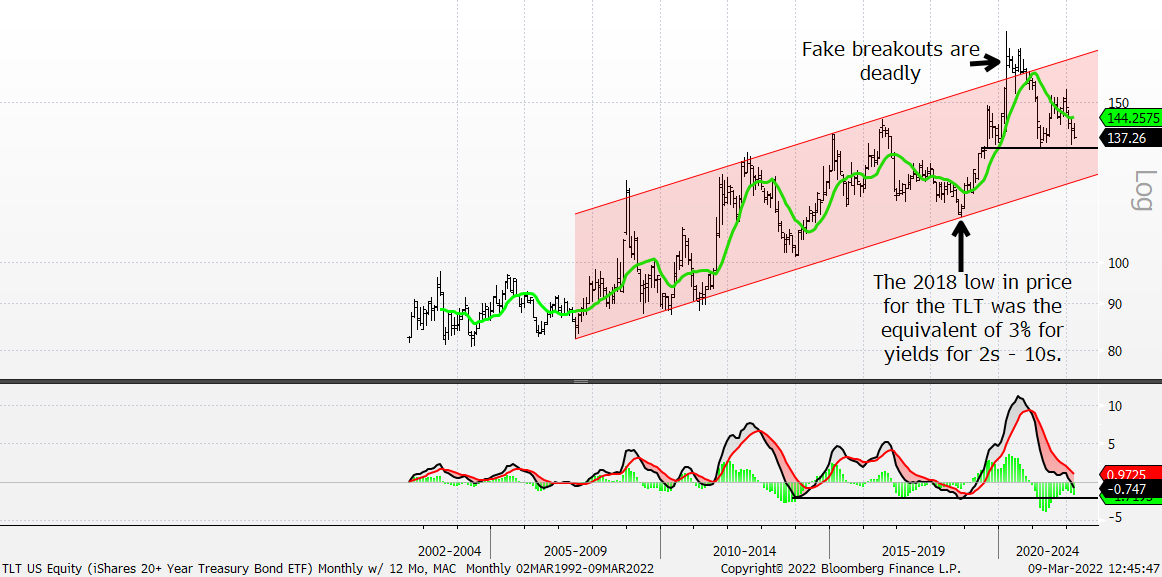
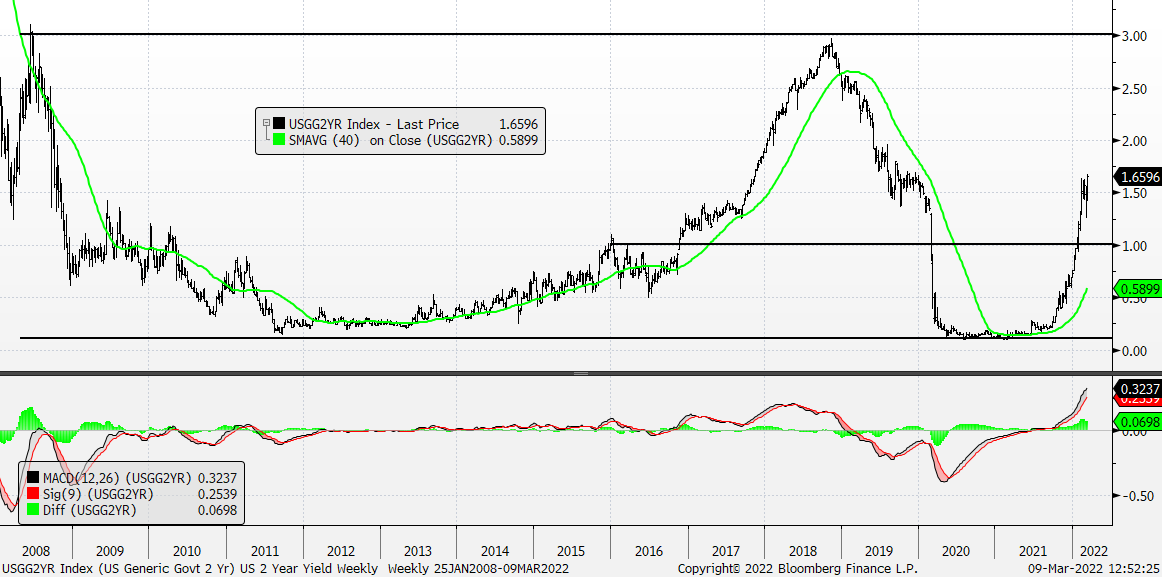
C – Yields, especially the 2-Year Treasury Yield, did not really pull back as equities were correcting over the last few weeks telling us that bond prices were not “the safety trade” they usually are when equities are in distress. The chart below shows a monthly version of the iShares 20+ Year Treasury Bond ETF (TLT) and we’re expecting its price will break the horizontal support line and work down to the bottom of its trend channel. We continue to expect that yields across the curve will work to 3%, their highs from 2018.
US 2 Year Yield – Weekly w/ 40-Week Moving Average and Weekly MACD
US 2 Year Yield – Monthly w/ 12-Month Moving Average and Monthly MACD