Though it was 1971 when the great Marvin Gaye sang these opening lines
Woah, ah, mercy, mercy me
Ah, things ain’t what they used to be
to his hit Mercy Mercy Me, they could very well apply to this period, too, because things definitely ain’t what they used to be.
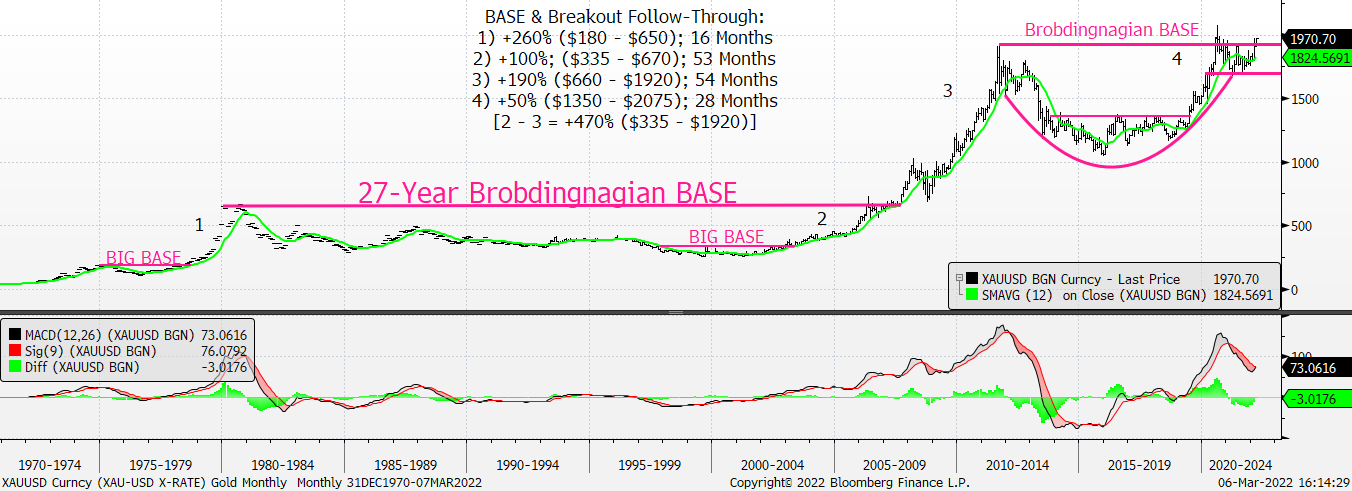
A – Gold closed @ 1970.7, up 4.3% on the week and up for four of the last five weeks. Gold has only ever traded higher than 1970 during three weeks in August 2020. We’ve been looking for a new all-time high since November, but it’d be hyperbolic to offer post-breakout targets now when gold hasn’t yet broken out. Our chart shows gold’s history after a breakout has been pretty darn spectacular. We still believe it is not widely owned.
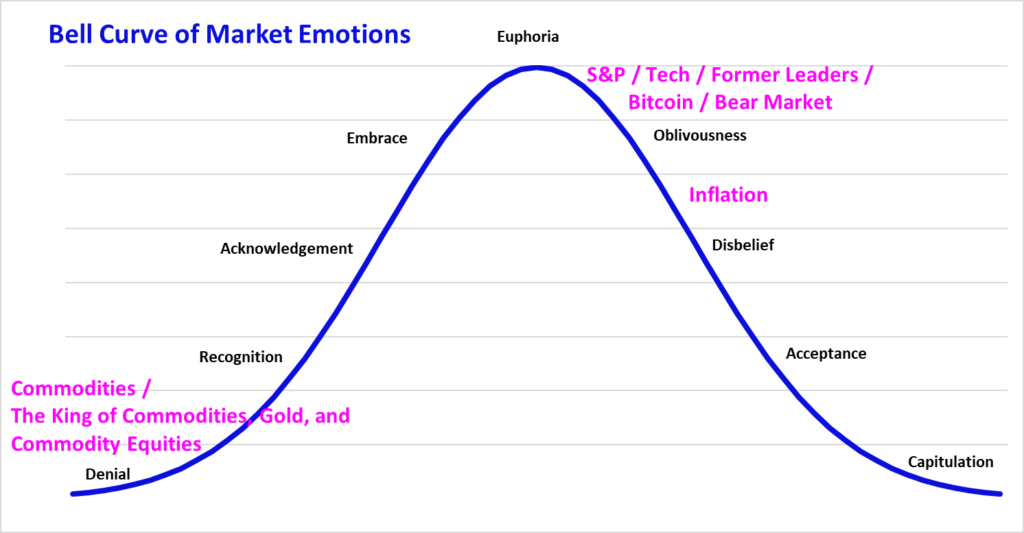
B – When investors / the business media wax as eloquently about gold as they’ve done for bitcoin, we’ll figure commodities are in the euphoria stage. But it ain’t anywhere near that now.
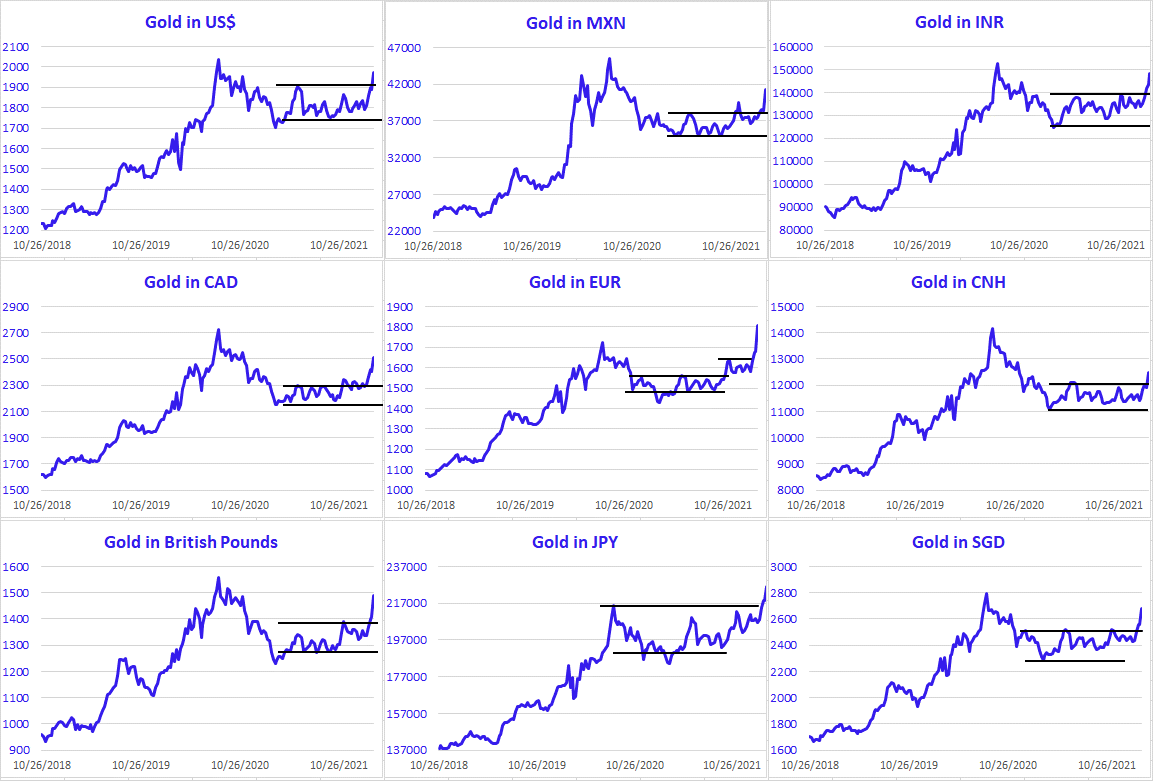
C – If all you knew about gold was found in these charts what would you say?
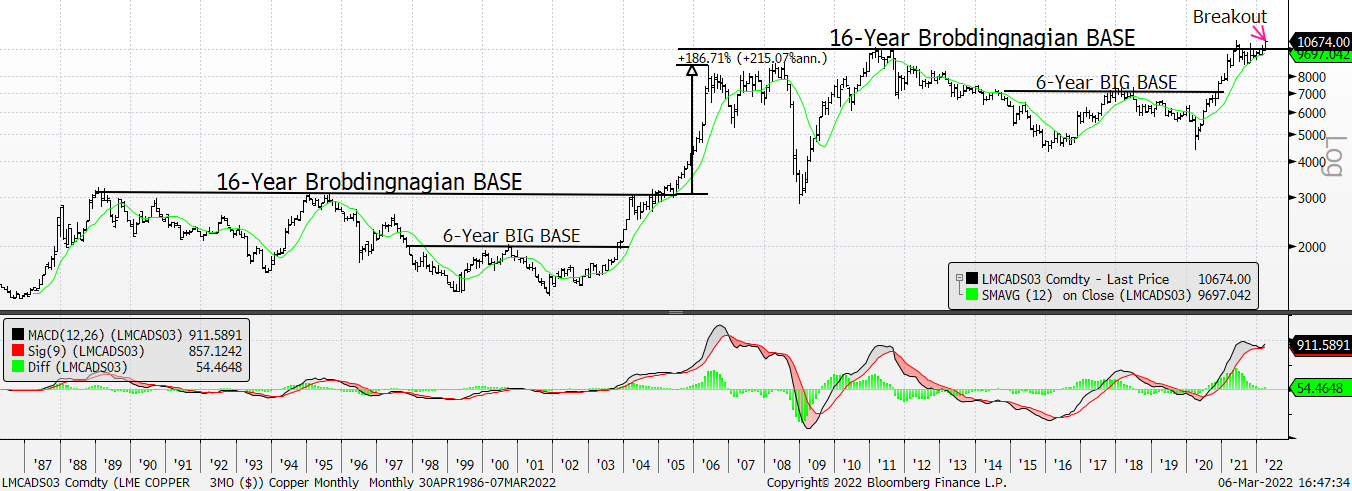
D – Copper was up 8% last week and completed its 16-year Brobdingnagian BASE.
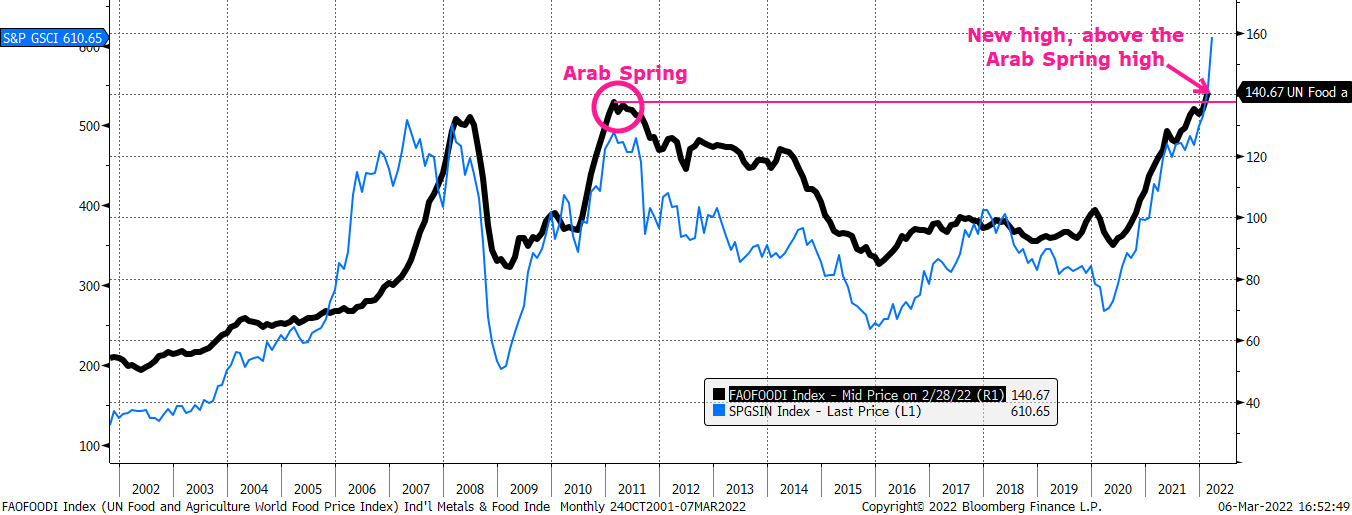
E – As we say in our 22V weekly webinars, you don’t need any technical skills to see that Industrial Metals Prices and World Food Prices are well correlated over time. The Metals Prices Index has been at new highs for three months and the Foods Prices Index is now above its former all-time high, the Arab Spring high, from 2011. It’s not a stretch for us to say that surging food inflation is raising the specter of social instability. For example, Egypt gets 86% of its wheat imports from Russia & Ukraine & is struggling to secure supplies right now. In 2011 rising food costs helped spur Arab spring protests. It might seem strange now, but what if the government starts sending checks to Americans to help pay for their groceries?
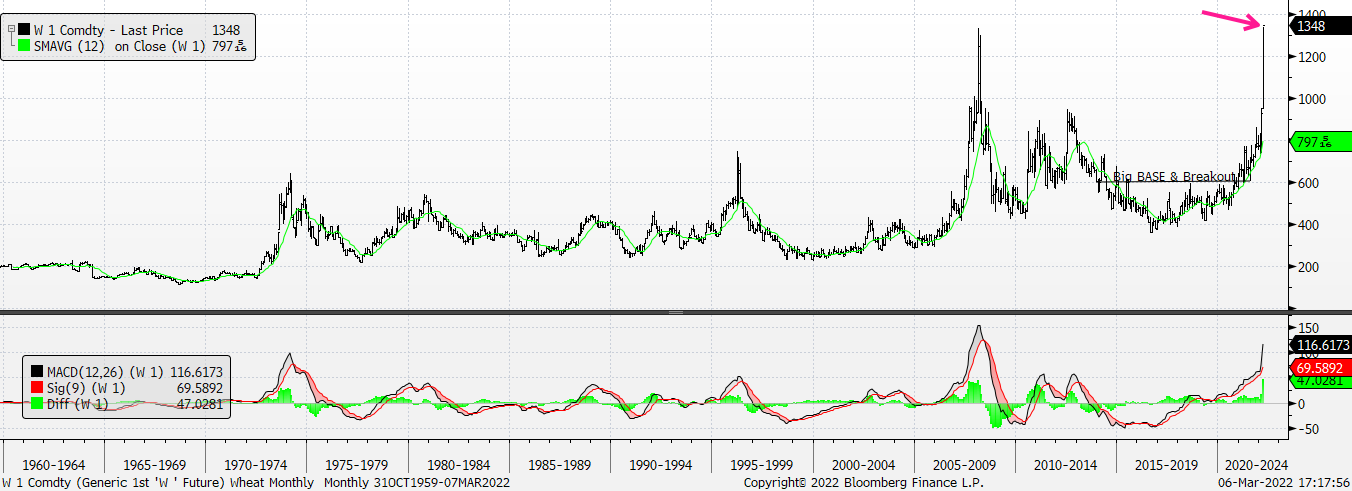
F – During COVID many became arm-chair epidemiologists. In the last few weeks many are now offering insight into the Russia / Ukraine conflict. How long before everyone is a grain expert? This is a monthly chart for wheat. The May futures contract was up 41% (not a typo) last week and the constant front month futures contract, represented here, is up more than 100% since it first rose above $6 in October 2020.
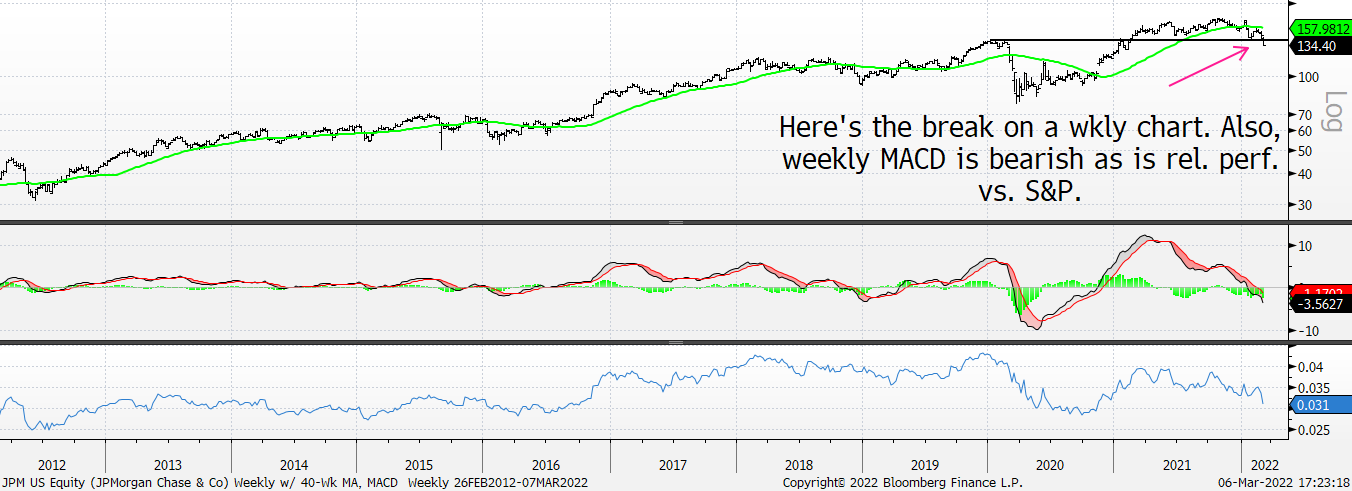
G – Why is JP Morgan below its pre-COVID high? It has a Technical Score = 0, is below its cresting 40-week moving average, weekly momentum is in negative territory, and relative price action vs. the S&P 500 (bottom panel) is bearish, too. Our downside target is $100, but why is JPM below its pre-COVID high?
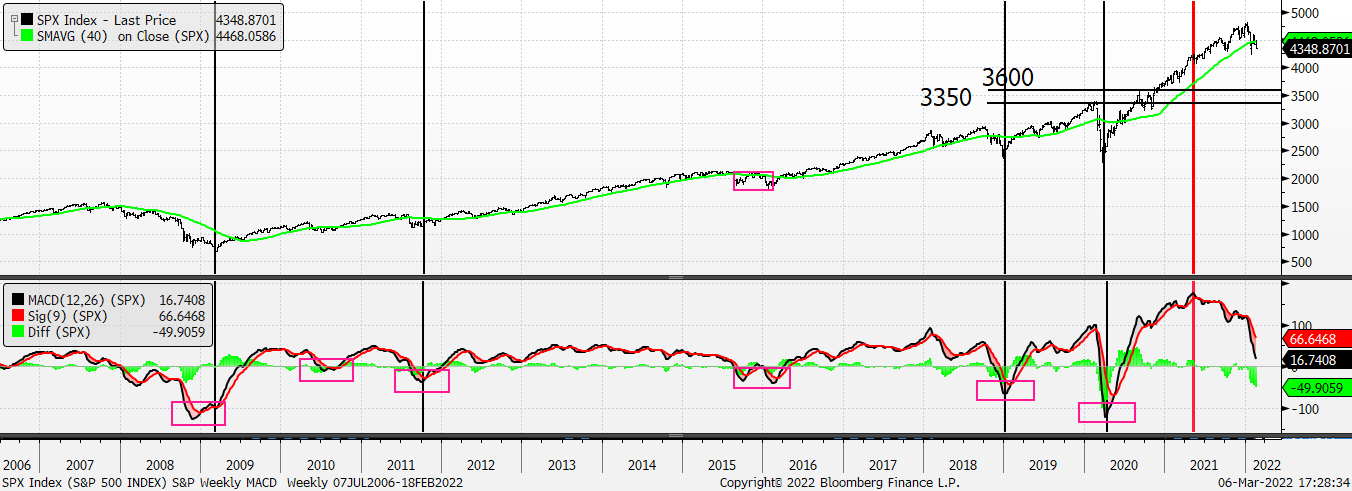
H – The S&P 500 has a debt to pay in that it has been carrying a negative momentum divergence since spring 2021! In the old neighborhood, somebody would be knocking on its front door by now. We continue to believe it works lower to 3600. Sell any bounce / rally. And it’s still overbought on a weekly basis, too.
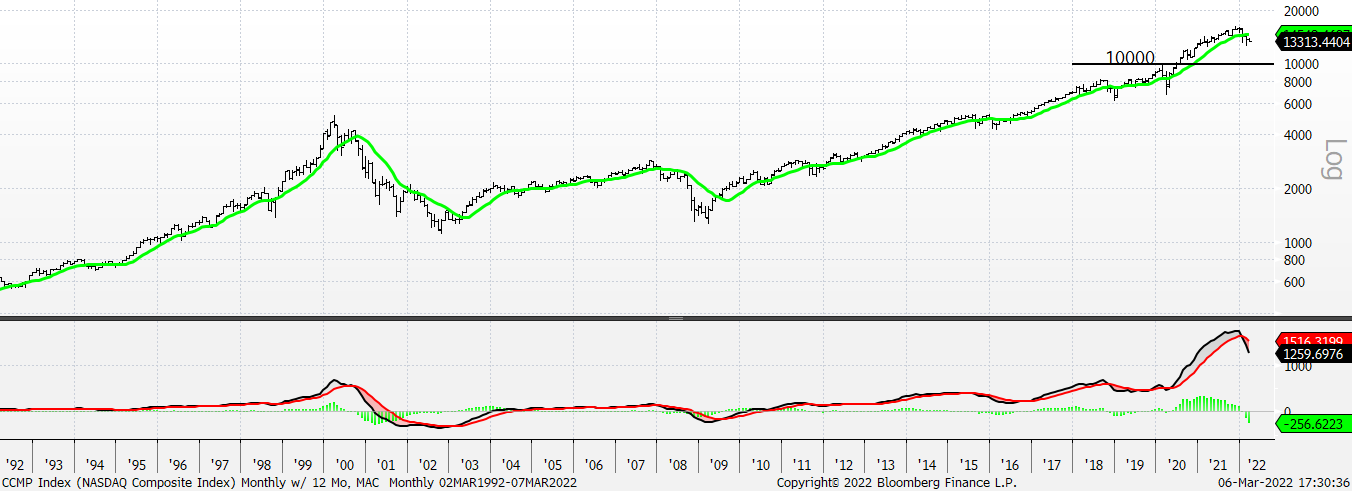
I – We still think our NASDAQ target of 10,000 looks reasonable. Especially when you consider this monthly chart.
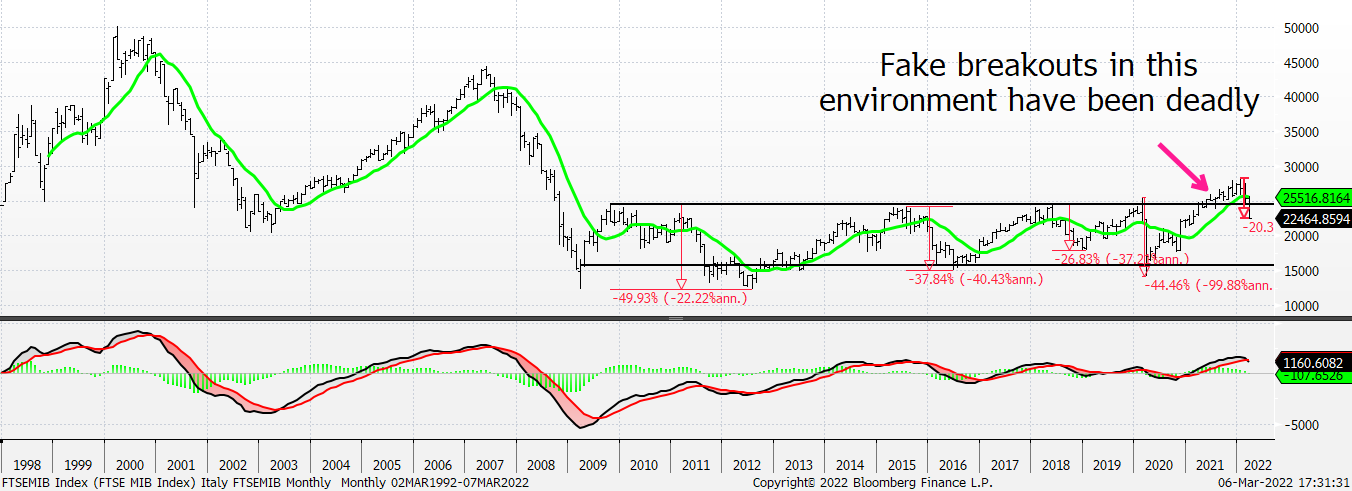
J – If all you had for the FTSEMIB of Italy was this chart wouldn’t you be looking for it to get to the bottom of its former range? Especially since its breakout was a failure?
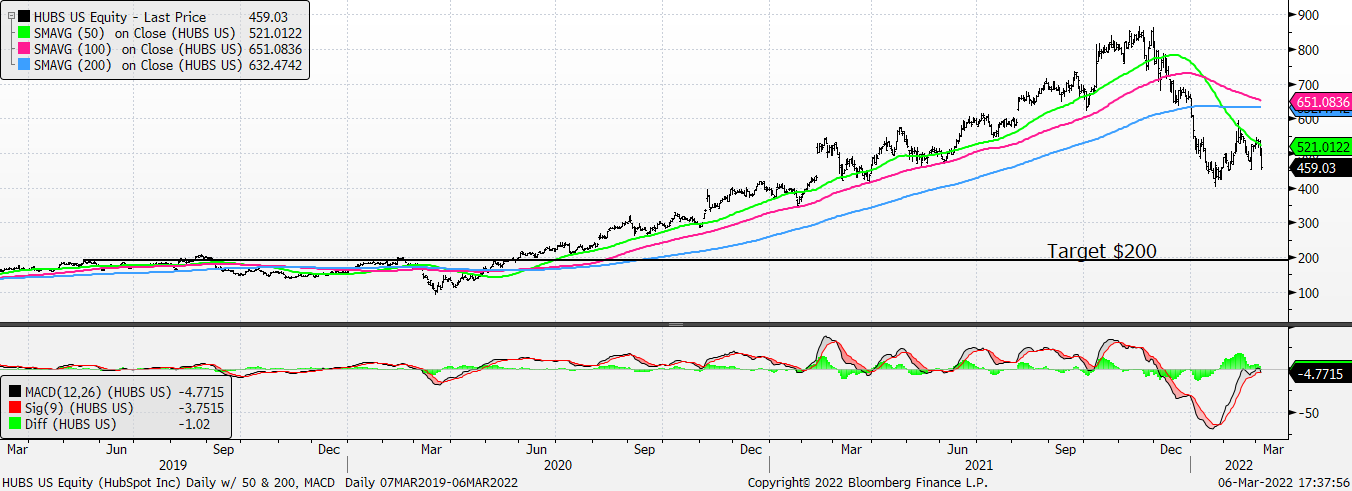
K – HubSpot (HUBS) is down 50% from its Nov 21 high and there are still 23 Buys, 2 Holds, and 0 Sells on the stock. It bounced 50% from its Jan low – mid-February high and its daily MACD could NOT get back into positive territory and the stock got the Dikembe Mutombo treatment at its downward-sloping 50-day moving average. We think it has risk to 200. Sell / sell short.
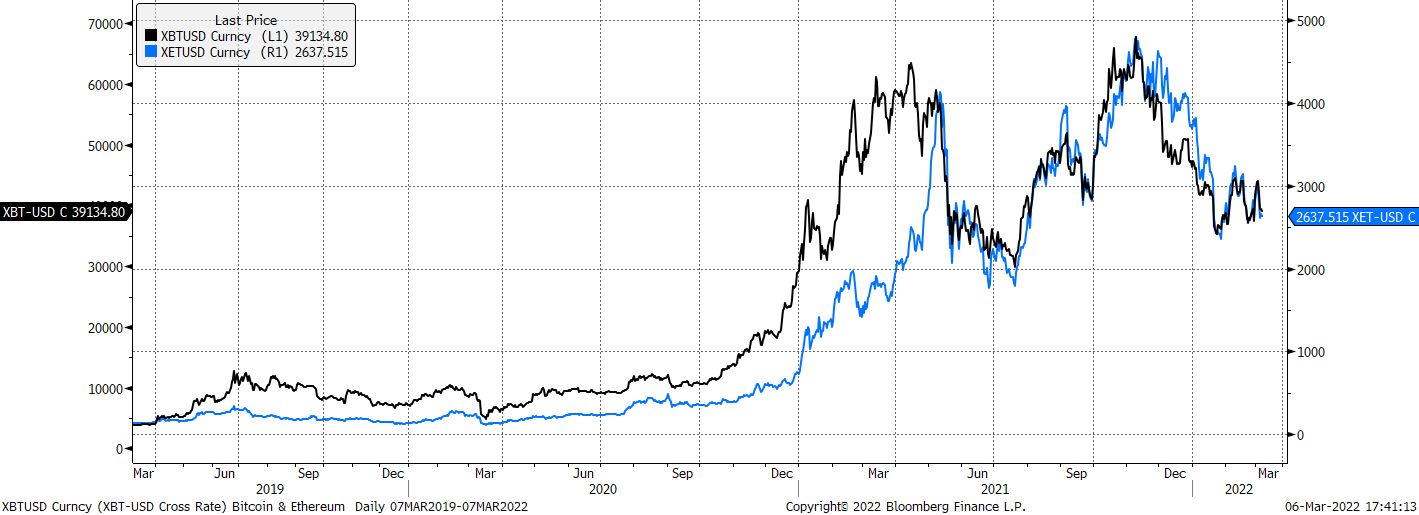
L – Bitcoin (black) and Ethereum (blue) still look like they’ll work importantly lower to us.
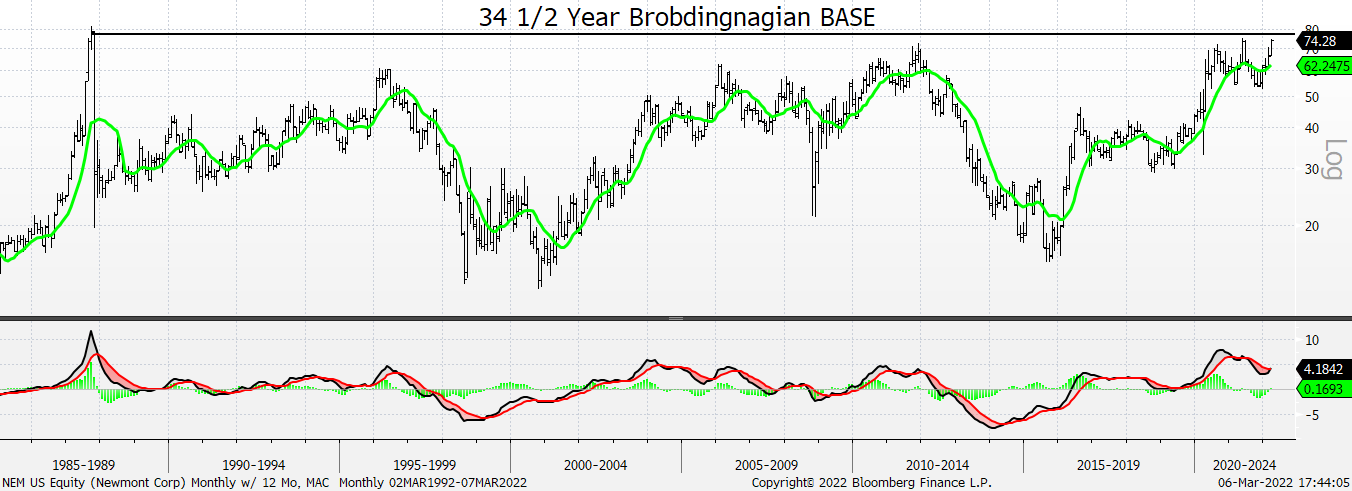
M – Newmont Mining possesses a 34 ½ Year Brobdingnagian BASE. If NEM were in Run-DMC it might say, “I’m the king of BASES, there is none higher; sucker MCs shall call me sire.”