It wasn’t so long ago that Tech stocks were nearly monolithically strong which meant finding shorts in that sector was a near impossibility. Now commodities exhibit near monolithic strength and have been doing so since the autumn of 2020. This role reversal for tech and commodities is not nearly as funny as what Felix and Oscar tried in The Odd Couple, but this one is likely to last a lot longer.
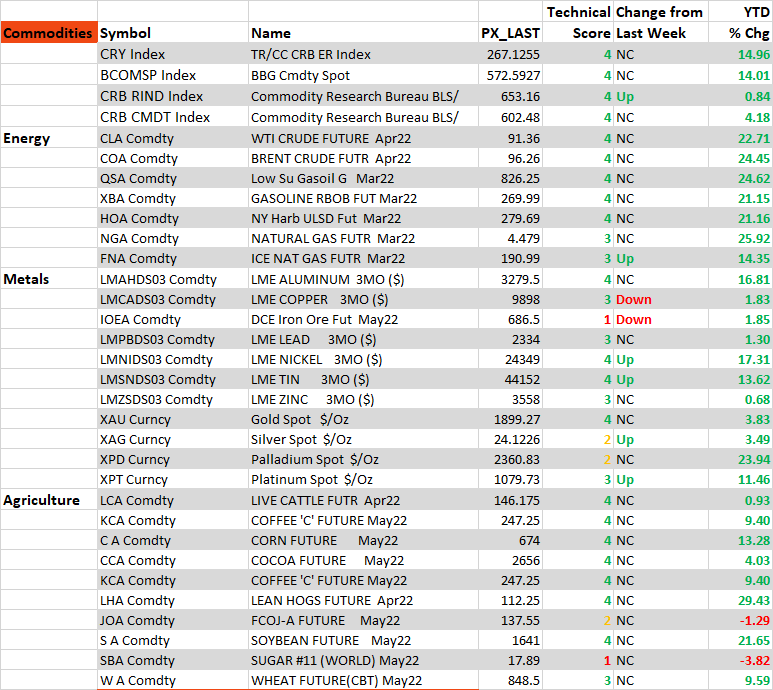
As you can see in the table below there are only two items – Orange Juice and Sugar – that are down, albeit marginally, in 2022. Moreover, 84% have good / strong Technical Scores while only one – again, Sugar – has a poor / weak Score. The average year-to-date gain for the 28 commodities is a bit more than 12% with Lean Hogs in the lead up more than 29% in 2022. The Energy subset is up, on average, 22%, Ags +9 ¼%, and Metals +8 ¾%. We continue to believe this commodity bull market has more to go.
Source: 22V Research
This chart shows the Bloomberg Spot Commodity Index Relative to the S&P 500. We don’t think it’s a stretch to say that it’s still early in the game for the numerator to outperform the denominators as the turn looks to be in its infancy.
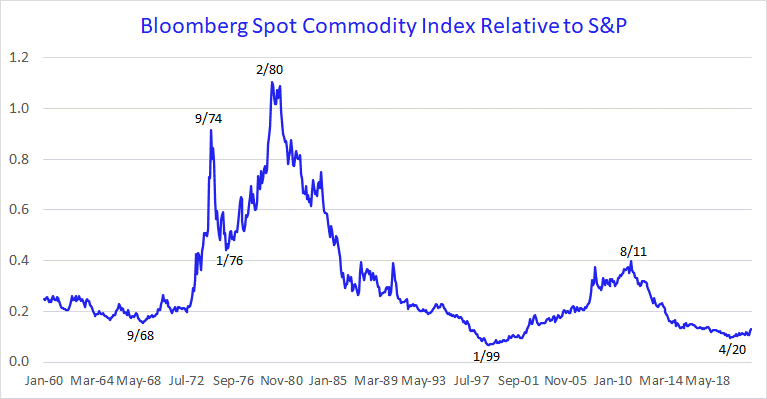
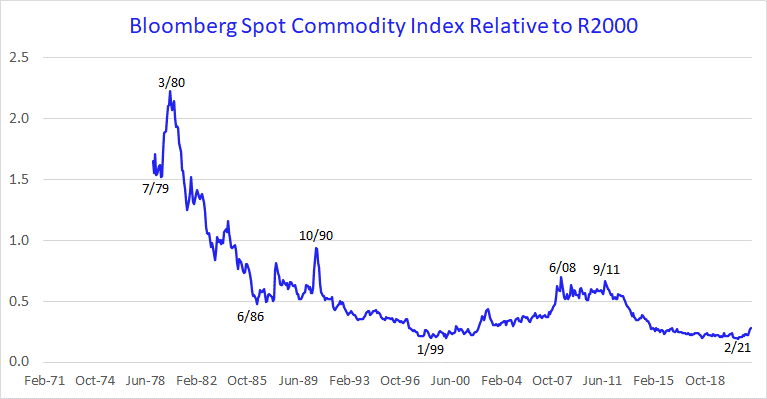
Longer-term perspective is likely needed to understand that commodity outperformance cycles are rare but when they do occur, they tend to last for a while. For example, the three prior long-lived cycles when commodities outperformed equities lasted from Sept ’68 – Sept ’74, Jan ’76 – Feb ’80, and Jan ’99 – Aug ’11.
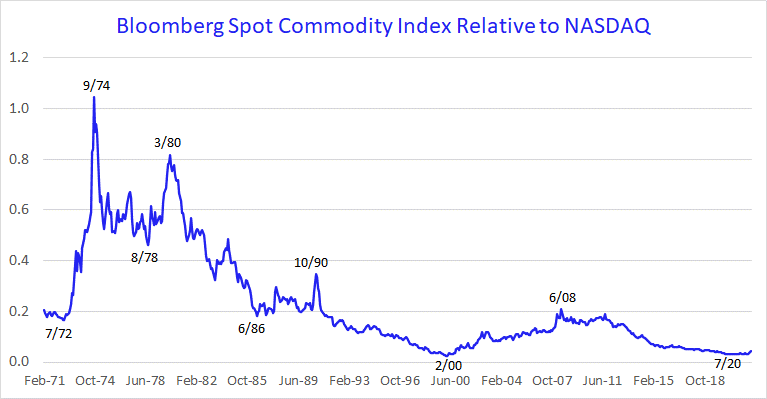
Since April 2020 when the BCOMSP bottomed versus the S&P the ratio is +41% and is at its highest level since December 2018 (above). Since December 2020 when the BCOMSP bottomed versus NASDAQ that ratio is +44% and at its highest level since June 2019 (below). And since February 2021 when the BCOMSP bottomed versus the Russell 2000 that ratio is +55% and at its highest level since June 2016 (below).
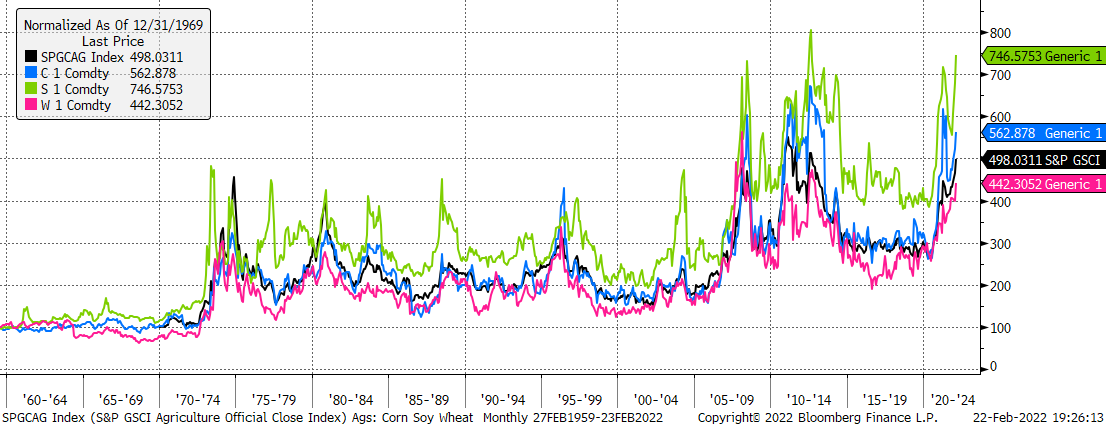
The chart here shows the S&P / GSCI Ag Index (black), corn (blue), soy (green), and wheat (pink). We continue to look for corn, soy, and wheat to trade to new all-time highs.
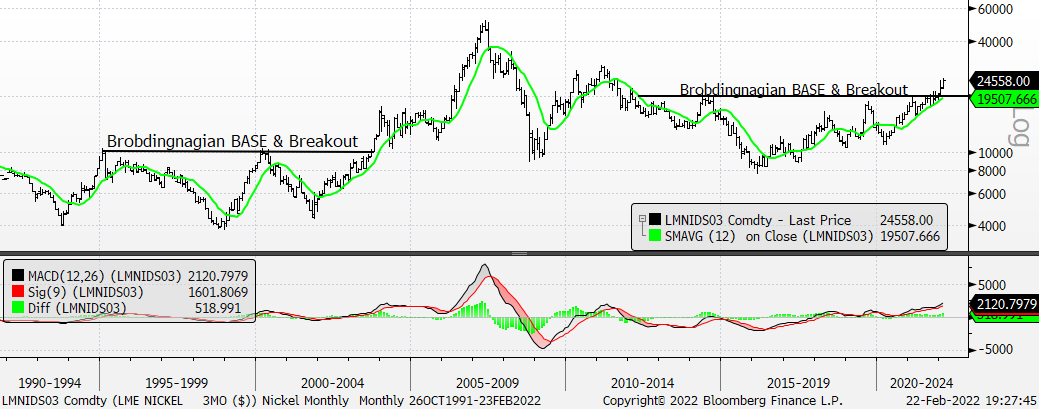
Nickel is the best performing industrial metal on the LME with a y-t-d gain of 20%.
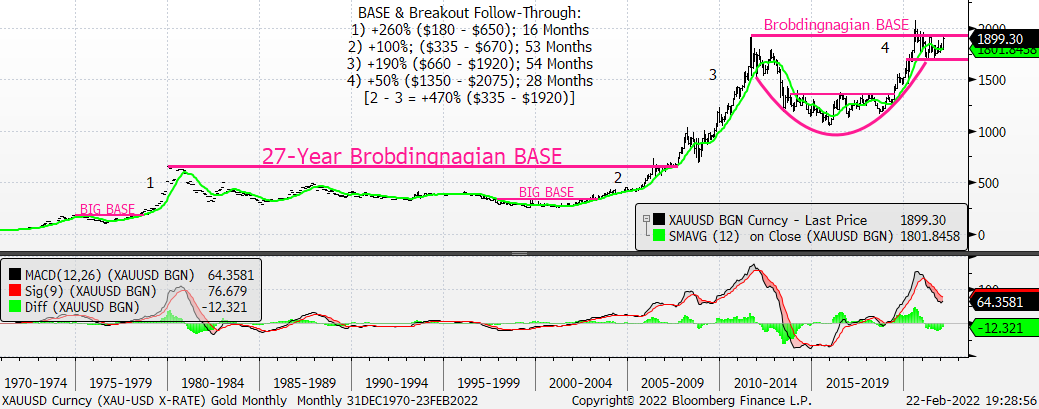
Gold has always been a BASE & Breakout metal, so we’ll wait for the breakout to estimate an upside target, but for right now we’re still looking for gold to make a new all-time high.
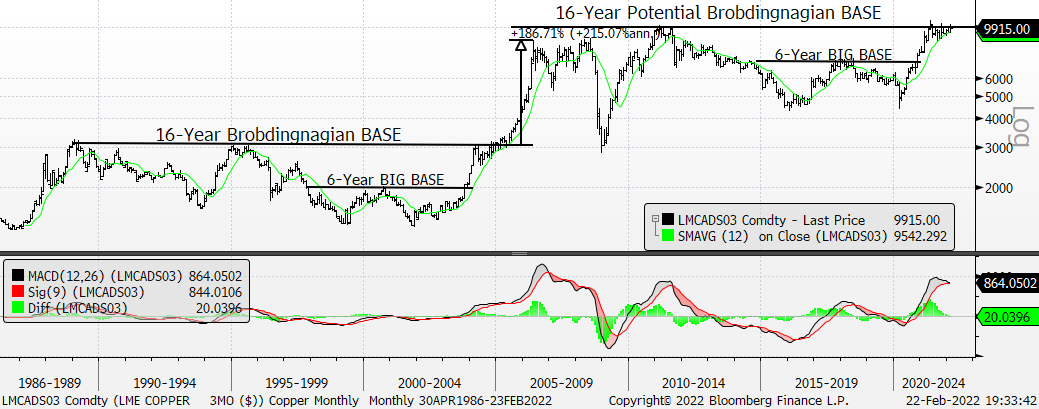
Copper hasn’t yet broken out, but we believe it will.