You might remember it was in 1984 that Chaka Khan had her biggest hit with “I Feel For You.” The song came from her album of the same name. You might also remember seeing her in concert during that time.
We thought of her song today because in speaking with a host of investors we get the distinct sense that many of them are using the “feel” test when we ask for their take on the market, in general, and tech, in particular. It sounds something like this, “It feels like tech has been hit too hard…,” or “I feel like I should be buying some Facebook here. It’s been punished…,” or “How much can PayPal go down? Feels like it’s more than oversold…,” or “I feel like everyone is already under-weight tech…,” or “Tech’s a lot cheaper than it was, I feel like I should be doing some buying…,” or “It feels like the Fed is not going to do anything to harm the market.” You get the point. To be sure, the Fed comment pervades nearly every conversation.
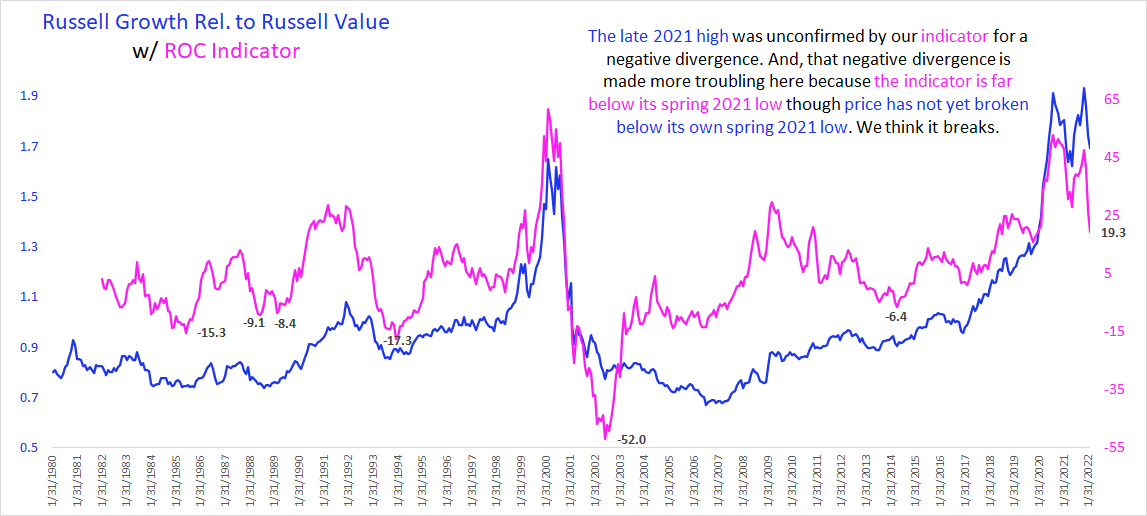
Usually, we go with our own Growth / Non-Growth Ratio, but data for both the Russell Growth and Russell Value indexes goes back to 1980 so we’re using a relative ratio for these two instead. While it is reasonable to see the current period in the chart below and immediately compare it to the prior peaks for the ratio and our indicator in early 2000, we don’t think you need to do that to be “concerned”; rather, you do that to be “especially concerned.”
For those in the “concerned” camp consider that in the just ended cycle (please recall we believe the upcycle for Tech / Growth is over) we saw historically excessive momentum on the upside, we saw momentum break, and we now see momentum’s turned sharply lower then you might agree with us that the oversold readings of the mid-80s, mid-90s, and 2014 occurred at, roughly, the -6% to -17% level. Right now, however, this indicator is still +19%. Again, even if you’re in the “concerned” camp then you probably will agree that the current turndown is not yet consistent with prior historical turndowns not commonly referred to as bear markets.
The chart here contains monthly data, and it is consistent with what we’re seeing in other monthly data series and indicators.
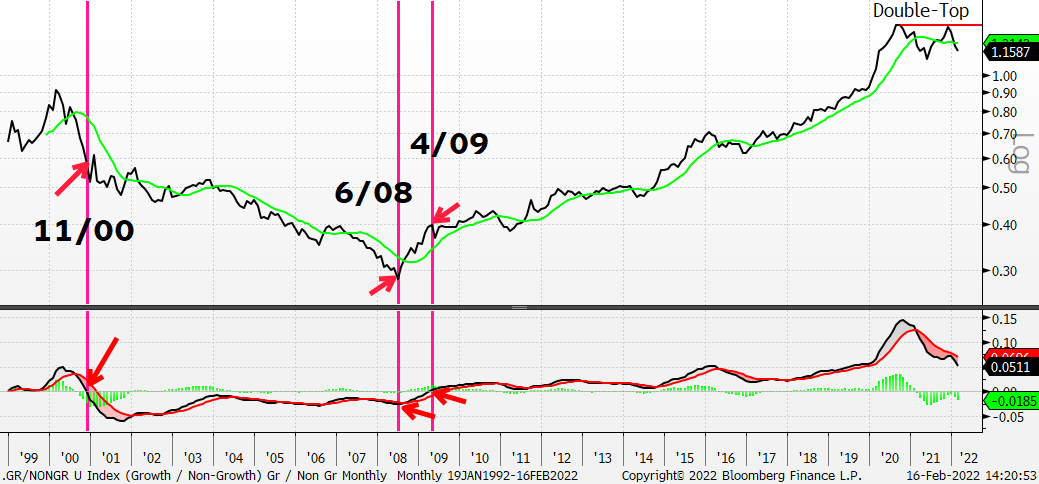
For example, here’s what our Growth / Non-Growth Ratio looks like on a monthly basis. The chart is annotated with the key inputs for those “especially concerned” because the last time our Growth / Non-Growth ratio broke it stayed in a downtrend for about eight years and bottomed in 2008. The monthly MACD stayed oversold from Nov ’00 – through the June ’08 low for the ratio and did so until the spring 2009 breakout. Translation – sometimes oversold can stay oversold for a long time. It might be that we’re reading too much into what we’re hearing, but we get the distinct sense that nobody is prepared for growth / tech to stay oversold for a long time.