Seinfeld 7
Fans of Seinfeld will easily remember the episode when George tells his fiancée, Susan, that he wants to name their first born – boy or girl – Seven.
George: Oh, no no no. Course not. I got a great name for our kids. A real original. You wanna hear what it is? Huh, you ready?
Susan: Yeah.
George uses his finger to draw the number 7 in the air.
Susan: What is that? Sign language?
George: No, Seven.
Susan: Seven Costanza? You’re serious?
George: Yeah. It’s a beautiful name for a boy or a girl…
Susan scoffs.
George: …especially a girl. Or a boy.
Susan: I don’t think so.
George: What, you don’t like the name?
Susan: It’s not a name. It’s a number.
George: I know. It’s Mickey Mantle’s number. So not only is it an all-around beautiful name, it’s also a living tribute.
Susan: It’s awful. I hate it!
George: (angry) Well, that’s the name!
Susan: (also angry) Oh no it is not! No child of mine is ever going to be named Seven!
George: (yelling) Alright, let’s just stay calm here! Don’t get all crazy on me!
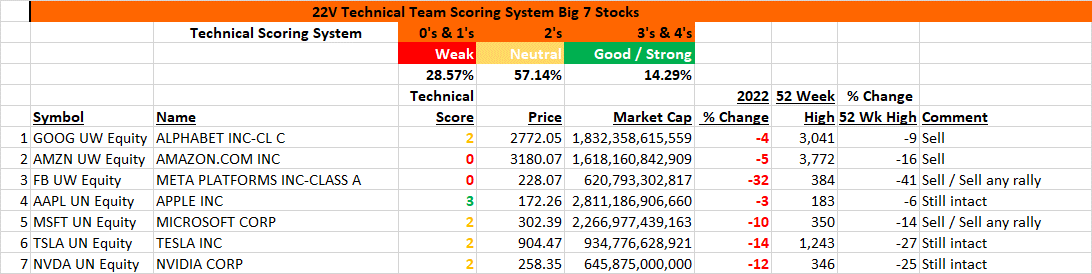
Seven was of great importance to George, and it’s of utmost importance to market participants because price action for The Big 7 – AAPL, AMZN, FB, GOOGL, MSFT, NVDA, and TSLA – is concerning. Yet, beyond the obvious and immediate implications for portfolios is the fact that there are not seven stocks anywhere in the world more widely held than this septet. You know where your portfolios stand, but here’s how these stocks are distributed via ETFs: AAPL 155, AMZN 142, FB 138, GOOGL 118, MSFT 175, NVDA 153, and TSLA 134. The combined market value of these stocks in the 1,105 ETFs is $1.034T.
From its peak on November 19 through its Jan 27 low, our Big 7 Index dropped 20% underperforming the NASDAQ which fell 17%, the NDX which gave back 15 ½%, and the S&P 8%. We’ve tried to be explicit over these many months as to the weighty importance of these stocks in the S&P, 26%, and NASDAQ, 40%, and noted that these indexes had been insulated from the weakness that was occurring in the broader market. However, it’s going to take a miracle for the S&P and NASDAQ to not make new reaction lows – below their late January 2022 figures – if our Big 7 Index, as we believe, falls again.
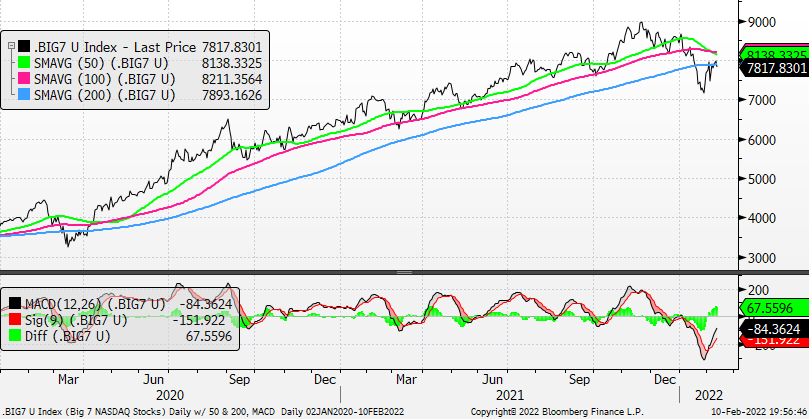
It is true that The Big 7 bounced more sharply on the recent rally than did the NASDAQ, NDX or the S&P but our index only rallied right back to its breakdown level and has been unable to get back above its cresting 200-day moving average.
Source: 22V Research
Big 7 – Daily w/ 50, 100, and 200-Day MAs and Daily MACD: Technical Score 2
Though the Index did record a deep oversold reading in late January, it’s not been able to get back above its breakdown level (8000) nor its cresting 200-day moving average and the daily MACD is still in negative territory.
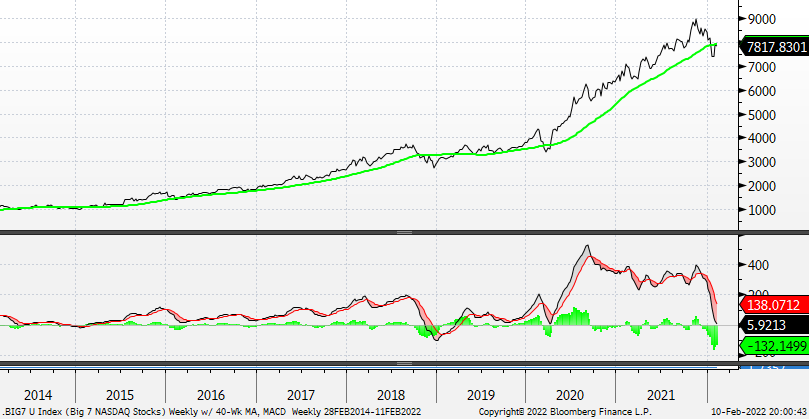
Big 7 – Weekly w/ 40-Week MA and Weekly MACD: Technical Score 2
Please notice that while the Index didn’t peak until November 2021 its Weekly MACD carved out its own peak in September 2020 which means that while price continued to advance it was carrying a negative momentum divergence of 14 months! Amazingly, despite the Black Diamond descent of the Weekly MACD it is not yet in oversold territory. We would not be surprised to see our Index make a new reaction low, beneath its January 2020 trough, and then weaken further to the 6000 level (23% below yesterday’s close).
 Big 7 – Monthly w/ 12-Month MA and Monthly MACD: Technical Score 2
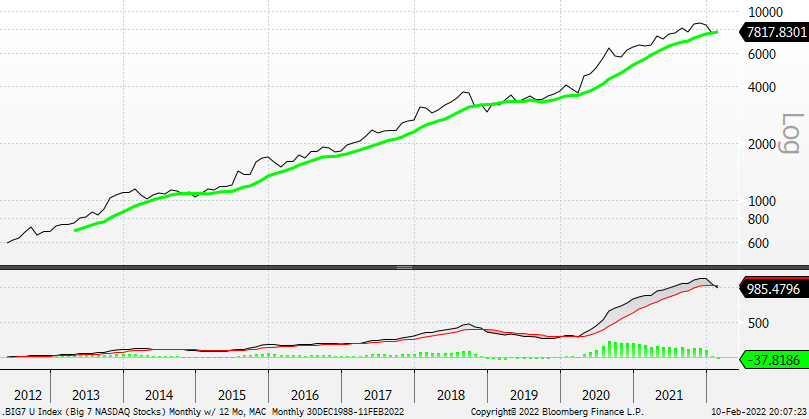
We’re showing this chart using a logarithmic scale to make sure that we cover all bases (the above weekly chart uses an arithmetic scale). There are a few things that stand out to us here: (1) Downside to 6000 seems tame, (2) A major decline could see the Index fall to 4000 which was the last breakout level in spring 2020, post the COVID low and (3) The Monthly MACD has just crested and is now rolling. If all you had to make your decision was that Monthly MACD, would you be buying our Index?
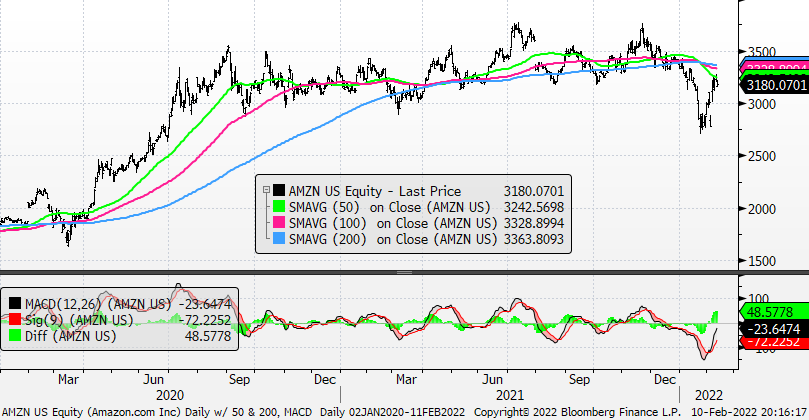
AMZN – Daily w/ 50, 100, and 200-Day MAs and Daily MACD: Technical Score 0
The stock did correct sharply – it has been the worst of The Big 7 – and has also bounced sharply but despite its earnings beat AMZN has been unable to climb back above its breakdown level of 3200. We still believe it is a sale. Risk to 2000.
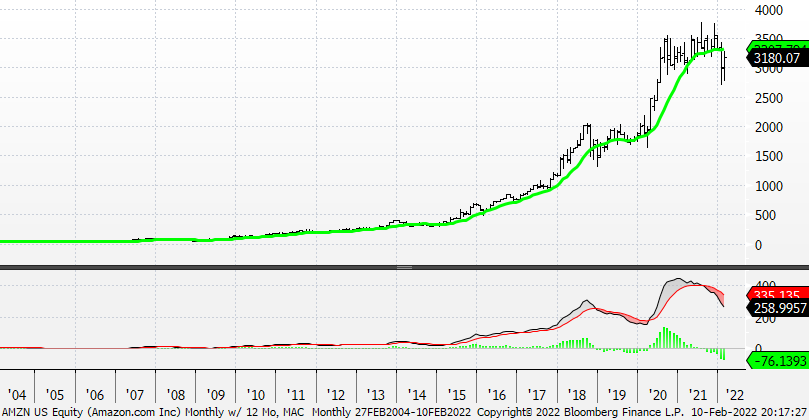
AMZN – Monthly w/ 12-Month MA and Monthly MACD: Technical Score 0
The stock has topped. We think our 2000 target is a bit clearer here.
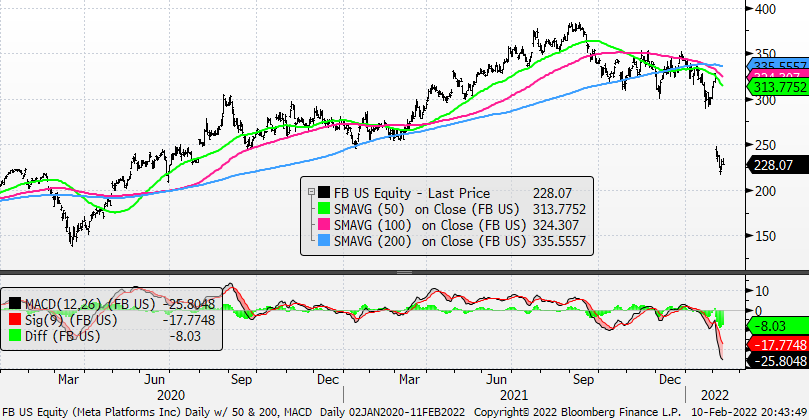
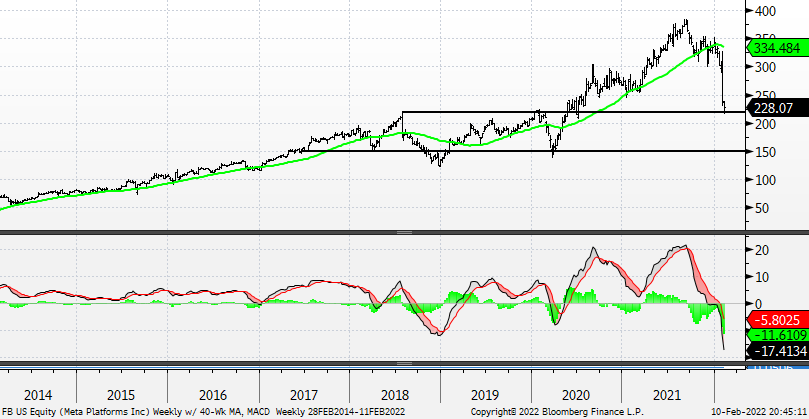
FB – Daily w/ 50, 100, and 200-Day MAs and Daily MACD: Technical Score 0
We find it remarkable that FB lost ¼ of a trillion dollars in market cap in a single day while market participants shrugged it off as if to say, “The bad news is behind it.” If any stock embodies the extreme nature of investor complacency it is this one. It would be extremely hard for us to believe that a stock can lose $250 billion dollars in one day and that we are left with a healthy market and that somehow, miraculously, FB won’t decline again. We don’t think we have a healthy market and we do think FB will decline again. Oh, one more thing, FB is a canary.
FB – Daily w/ 50, 100, and 200-Day MAs and Daily MACD: Technical Score 0
This might sound like nothing more than hyperbole, but FB at 150 wouldn’t surprise us. See following weekly chart.
FB – Weekly w/ 40-Week MA and Weekly MACD: Technical Score 0
The canary has already gotten back to its spring 2020 breakout following the COVID low. A break of this support would imply risk to 150.
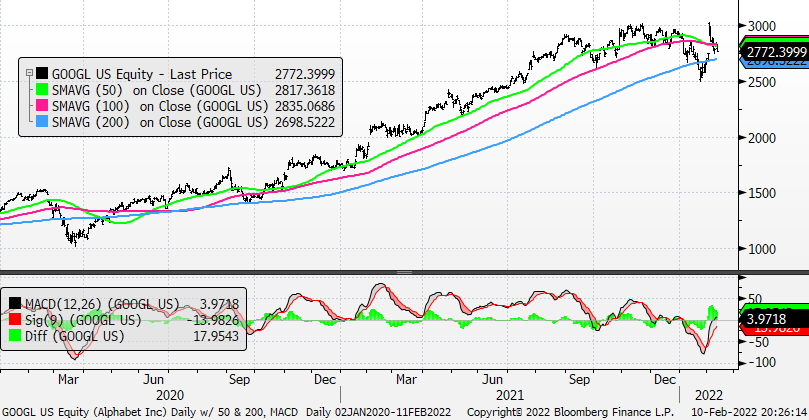
GOOGL – Daily w/ 50, 100, and 200-Day MAs and Daily MACD: Technical Score 3
It gets the benefit of the doubt from a trend perspective, but hasn’t the stock acted poorly since its earnings driven upside gap? We are sellers. Risk to 2000.
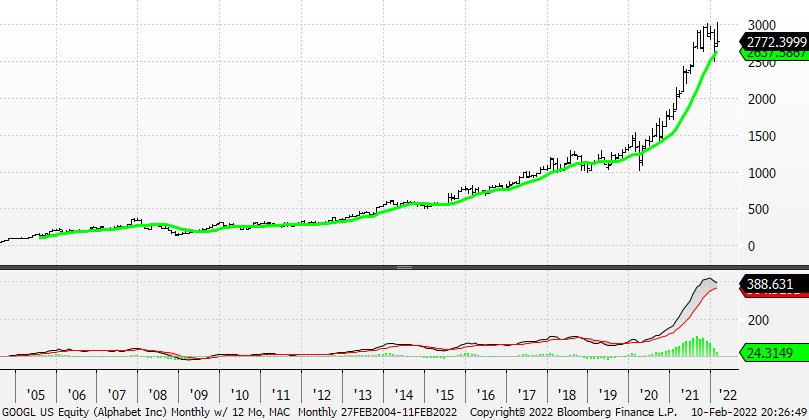
GOOGL – Monthly w/ 12-Month MA and Monthly MACD: Technical Score 3
The stock is topping. We think our 2000 is a bit clearer here. However, the AMZN 2000 would be the equivalent of seeing GOOGL near 1500.
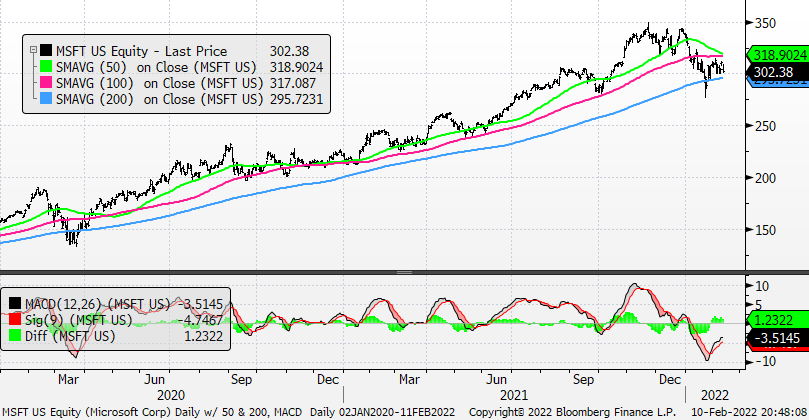
MSFT – Daily w/ 50, 100, and 200-Day MAs and Daily MACD: Technical Score 2
Another of the Last Emperors that hasn’t acted particularly stellar after its earnings release. We think it is also weakening and that it has risk to 250. The Weekly MACD shows another Black Diamond descent, and it is not yet oversold.
MSFT – Weekly w/ 40-Week MA and Weekly MACD: Technical Score 2
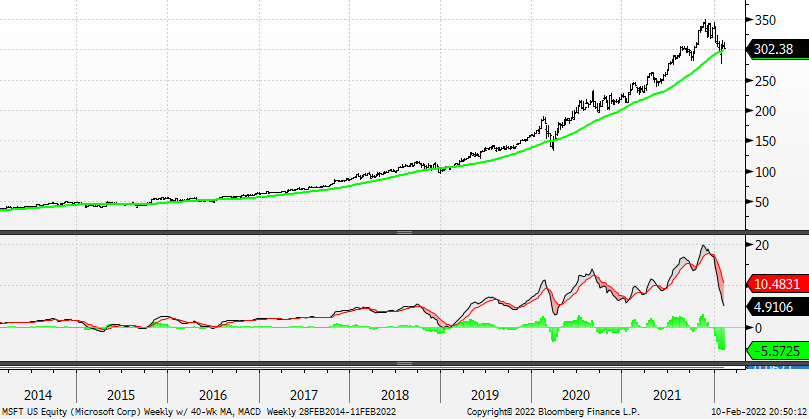
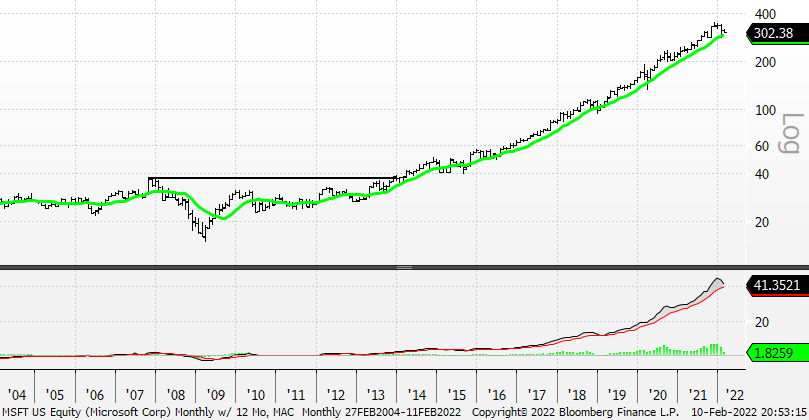
MSFT – Monthly w/ 12-Month MA and Monthly MACD: Technical Score 2
Since its breakout in early 2014, MSFT rose 800% into late 2021 and it has been up for 10 years in a row. Over those 10 years the stock had its best performance in 2019 – 2021 when it added 230%. In fact, the 2019 – 2021 three-year stretch was so good that it more than doubled what had been the stock’s prior best three-year stretch when it went up 108% from 2013 – 2015. If the law of large numbers was supposed to be an encumbrance, MSFT was blissfully unaware of any such restriction. Based on the logarithmic chart that follows we’d say that while a move lower to 250 would be a big hit, the Monthly MACD in the lower panel won’t even be damaged enough to be oversold. That’s how strong MSFT’s trend has been.