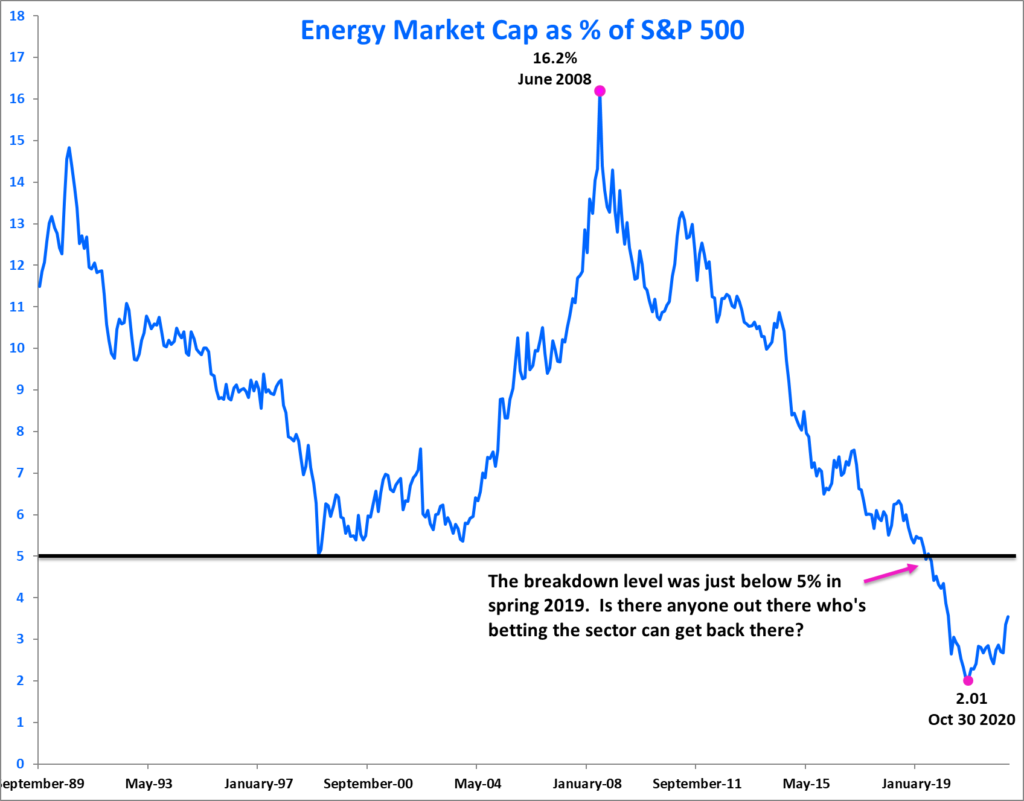
While the chart found below goes back nearly 33 years and shows that Energy, in the late 80s and again in 2008, commanded a 14% – 16% market cap weight in the S&P 500. However, it’s also true that Energy had a nearly 30% share of the S&P in the early 1980s.
The low print for Energy as a percentage of the S&P 500 occurred in October 2020 at 2%, down more than 90% from its peak. Our chart is annotated with comments made shortly after this data series started its consolidation in spring 2021 and we asked, “Is there anyone out there who’s betting the sector can get back to its breakdown level weight in the S&P of 5%?”
What with the S&P Energy Sector up 26% in 2022, and up 85% since December 31, 2020, the move to a 5% weighting in the S&P remains a pretty good idea. Not only is it being helped along by its own spectacular price performance, but it’s getting a boost from the slow deterioration in the market cap weight for Consumer Discretionary and Technology (please recall that these are the two Growth components in the numerator in our Growth / Non-Growth Ratio; Energy is one of the four Non-Growth components in the denominator for that ratio).
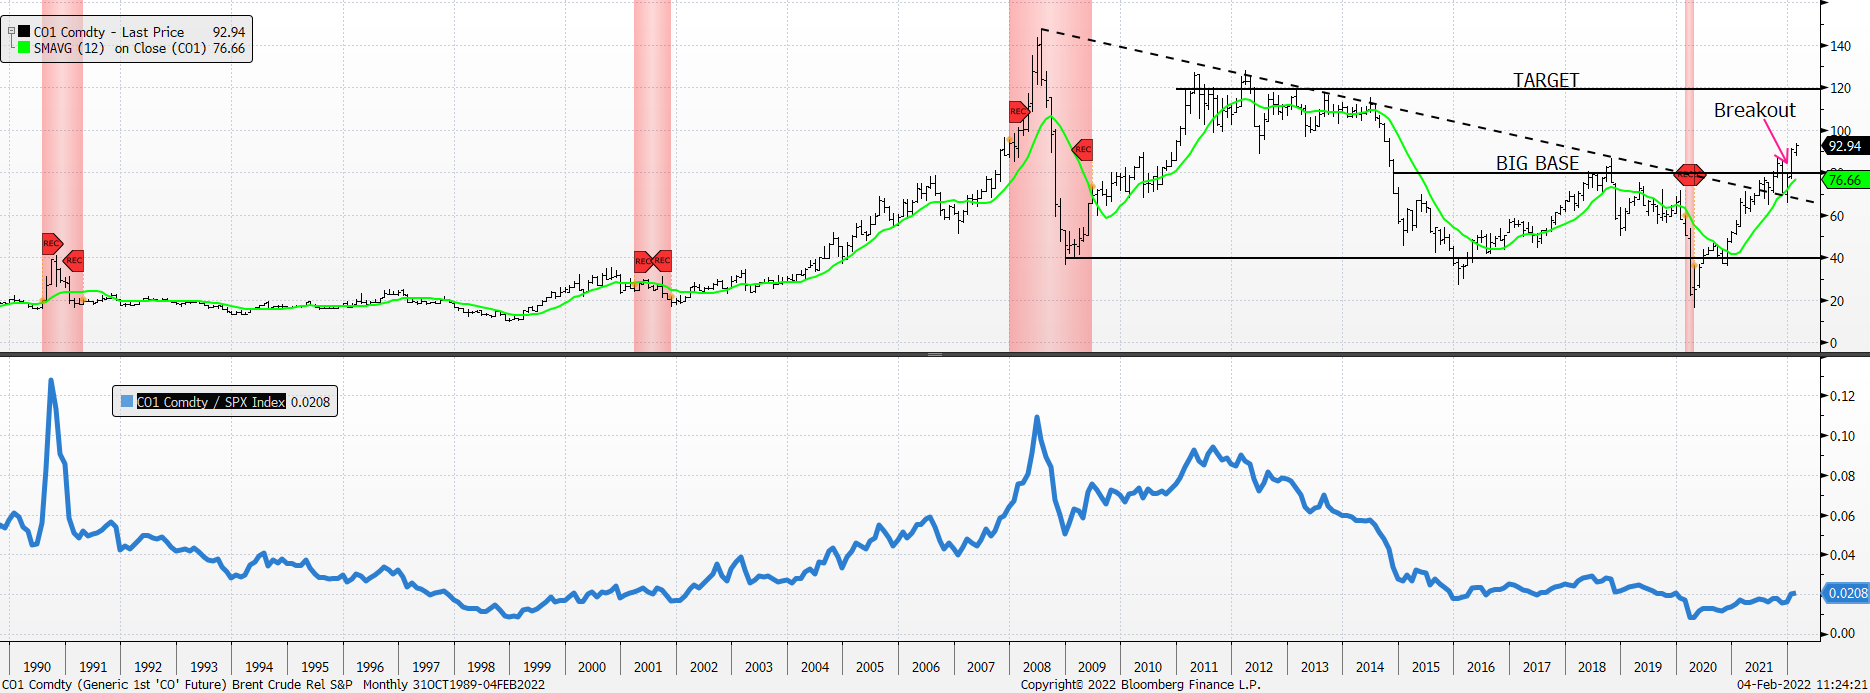
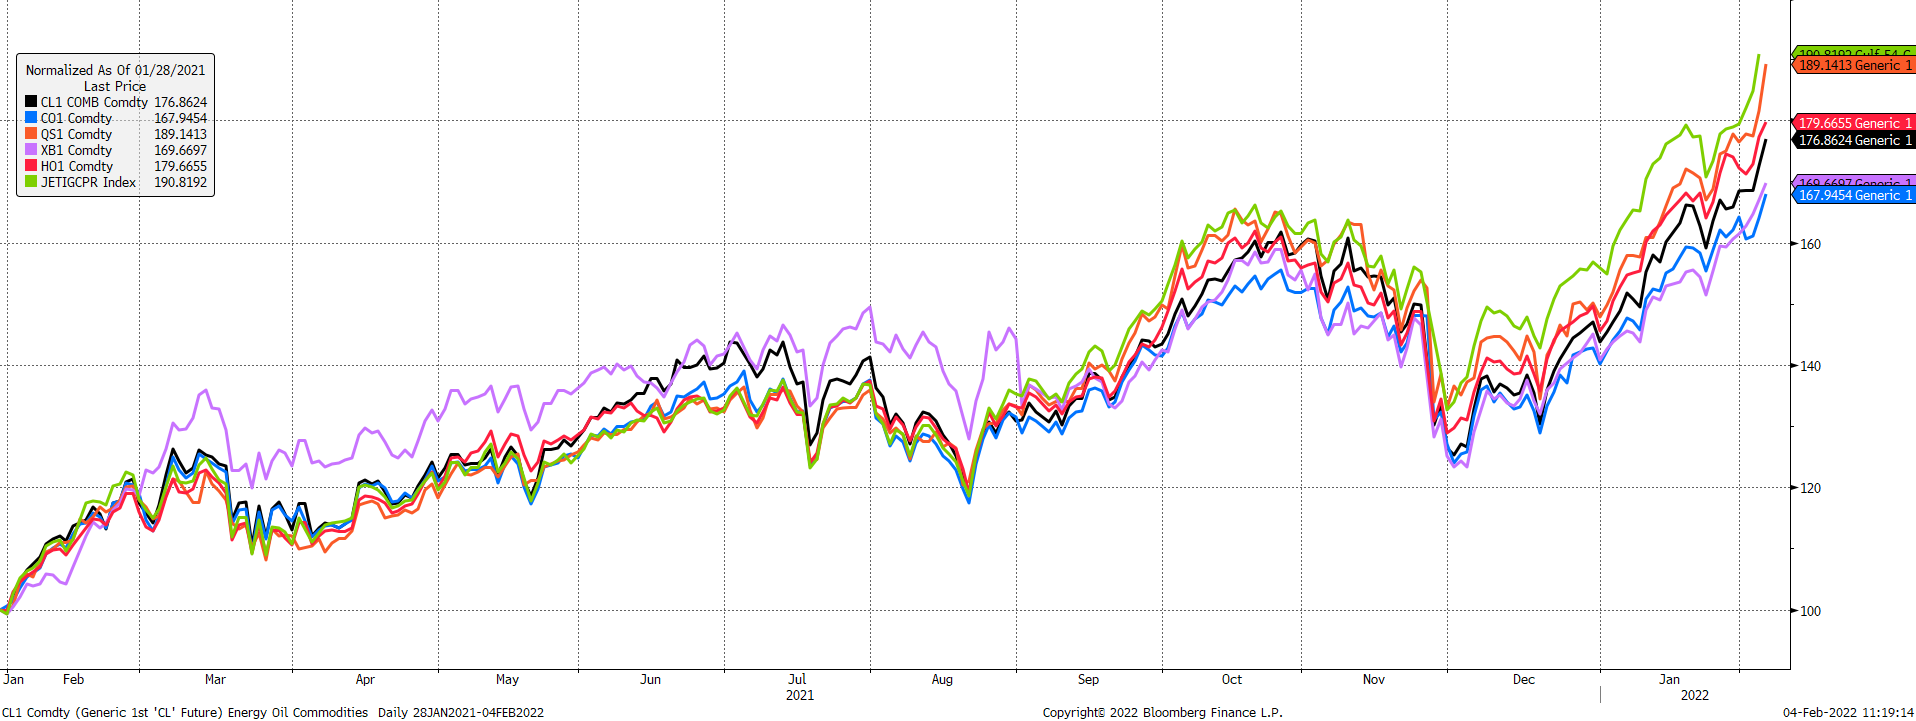
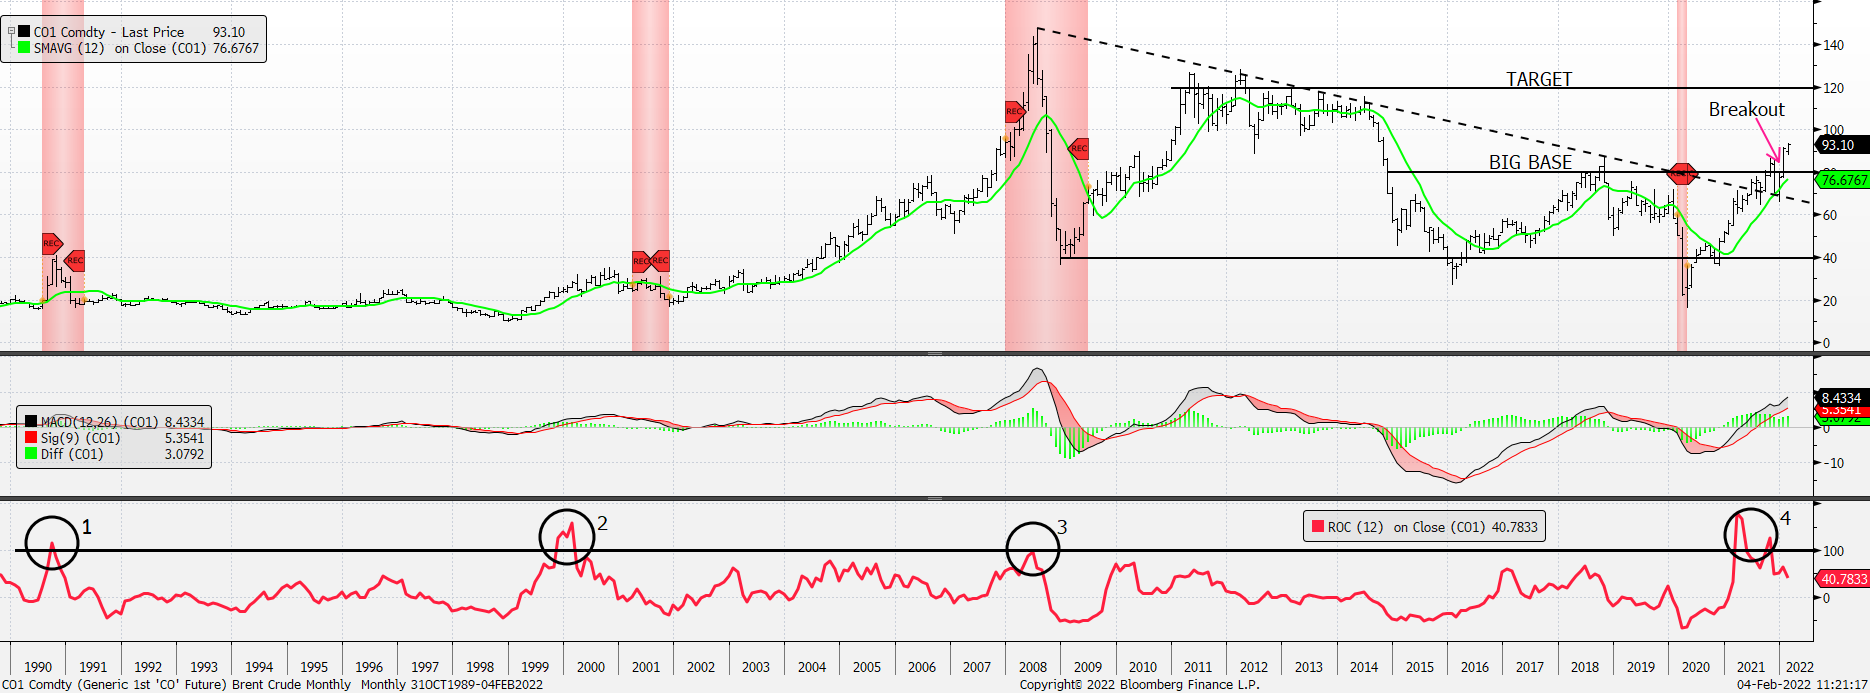
Oil related commodities are strong across the board (first chart) and our price target for Brent is $120 (second chart).
West Texas, Brent, Low Sulphur Gasoil, Gasoline, Heating Oil and Jet Fuel
Brent Weekly
Brent Weekly (top) w/ Brent Relative to S&P (bottom)