
Our entire repository of COVID charts is HERE.
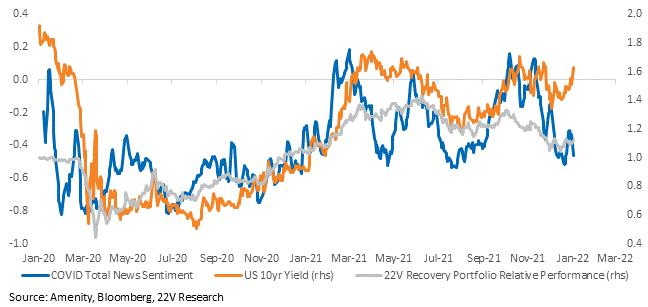
Total COVID news sentiment and sentiment concerning severe cases (hospitalizations and deaths), calculated using the Amenity Natural Language Processor, deteriorated last week. The 10yr yield has now diverged from COVID sentiment, increasing +19bps while sentiment worsened. The performance of our Recovery Portfolio has improved recently but has not increased in the same fashion as the 10yr. Poor sentiment is still a drag on COVID-sensitive stocks.

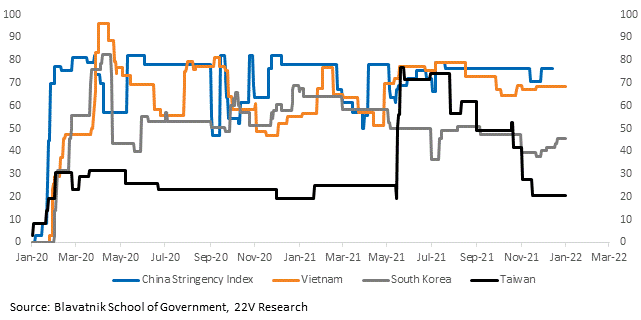
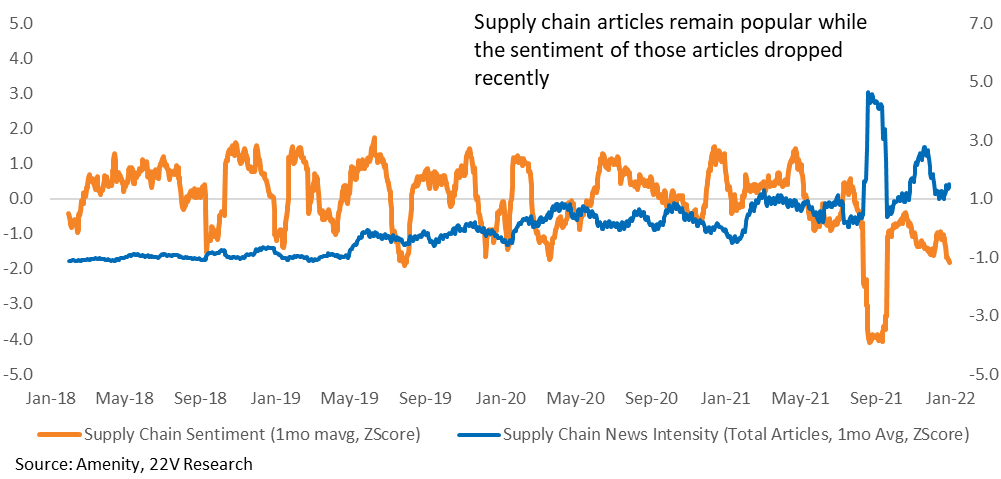
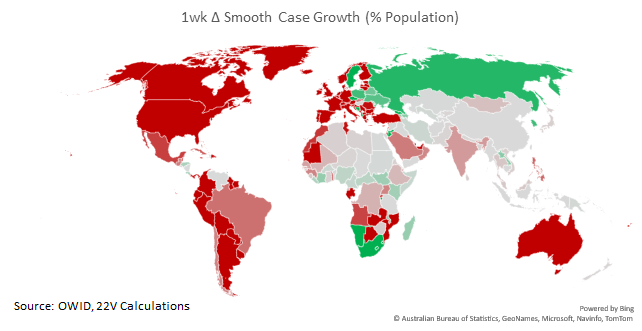
In mainland China, Zhengzhou became the second city of 10mil+ to be subjected to lockdowns. It appears that China is still committed to its zero-COVID policy. That creates some concern about supply chains. Supply chain sentiment declined again last weak while news mentions remained elevated. How countries respond to Omicron will have an important impact on supply chain issues near term, but there is not yet enough data to determine which way that will break. Case growth in Asia ex-China is, for now, tame. We are monitoring Oxford’s stringency indices to track the level of restrictions. Unfortunately, China’s score is not being updated. We are looking into why.
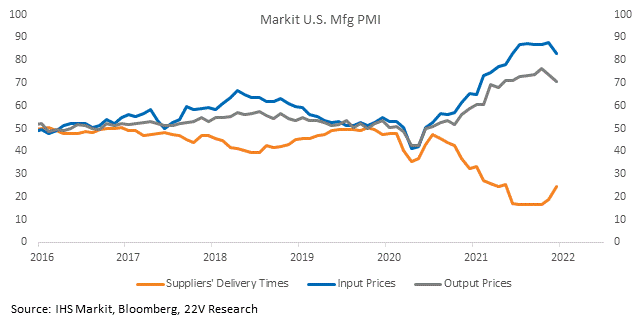
PMIs for December have indicated some improvement in supply chains. Although supplier delivery times, input prices, and output prices are all still extreme, all three moderated MoM.
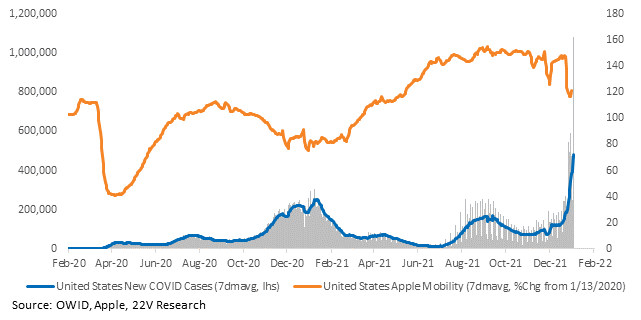
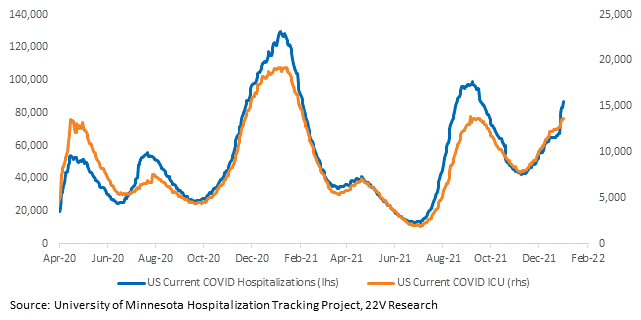
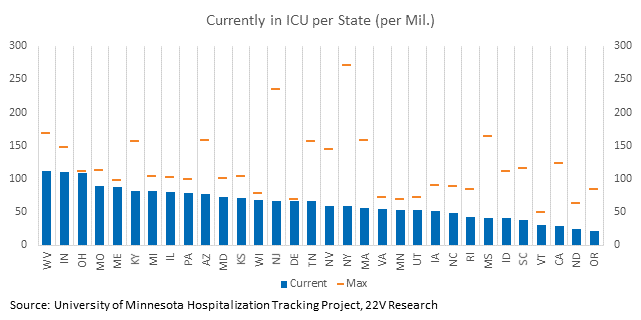
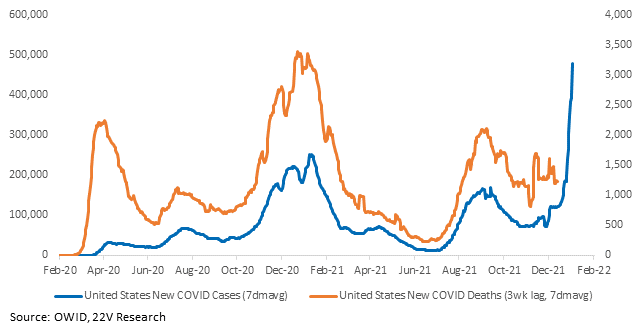
The CDC has estimated 95% of cases in the week ending 1/1 were Omicron. With case growth so high, it’s good 95% of the cases are a less severe strain. The number of people in the ICU is at the peak level hit in the Delta wave BUT activity was elevated during the Delta wave. So, that level is not particularly meaningful, especially considering current record case growth (FYI, there were not a million cases yesterday; the number is the product of irregular holiday reporting). No state is at record ICU levels individually. U.S. death data does not yet reflect the Omicron wave given its typical lag, but the data starting this week will.
Charts for every state and country we have data for are HERE.

