Source: Google Images
Twenty-year old Mike Tyson fought WBC Heavyweight Champion Trevor Berbick in November of 1986. Though Berbick was the champ (his record at the time was 31-4-1), Tyson (his record going into the fight was 27 – 0) was installed as the betting favorite. The fight was famous, not only because Tyson destroyed Berbick, winning by TKO at 2:35 of the second round, but because Tyson dropped Berbick with a right to body and a left to the head that resulted in Berbick falling to the canvas three times.
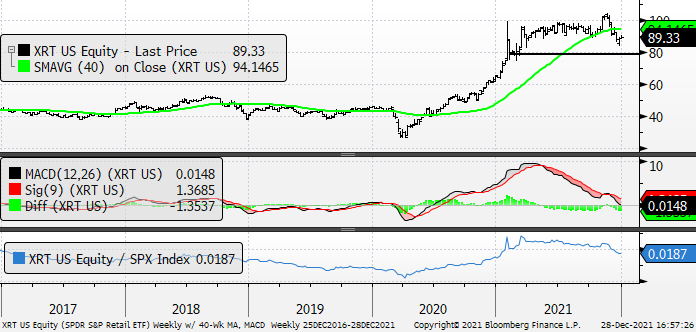
The table below focuses on seven weak ETFs so it’s no surprise that their Technical Scores are overwhelmingly poor. While their Scores are a distinct negative, it is equally important to recognize that all seven of these ETFs are oversold on a daily basis yet are unable to rally strongly or strongly enough to move out of oversold territory. The inability to rally after recording an oversold reading merely reinforces their limp nature. Further, the inability to bounce after recording an oversold reading suggests firmly that the item in question is not finished going down. These ETFs are the market equivalent of Trevor Berbick – click the link above to see what we mean.
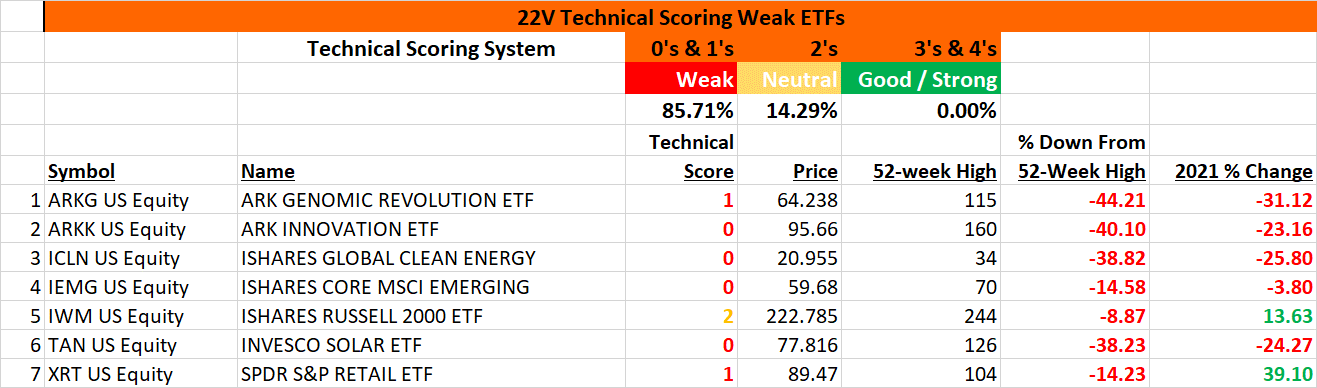
ARKG is certainly oversold and weak on a daily basis, but this weekly chart provides more depth and perspective. For example, ARKG has been below its downward-sloping 40-week moving average since it inflected lower in September, its weekly MACD has been in negative territory since May (!), and it is even weaker on a relative basis to the S&P than it is on an absolute basis. We are still looking for it to work lower to 40.
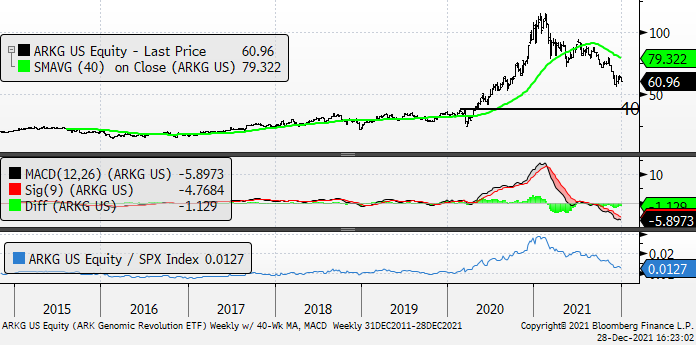
ARKK is in the same boat as ARKG. While oversold and soft on a daily basis, its weekly chart is worse. ARKK has been below its downward-sloping 40-week moving average since it inflected lower in September, its weekly MACD has been consistently uninspiring since May and downright awful since October, and it is also bad versus the S&P. We are still looking for it to work lower to 60.
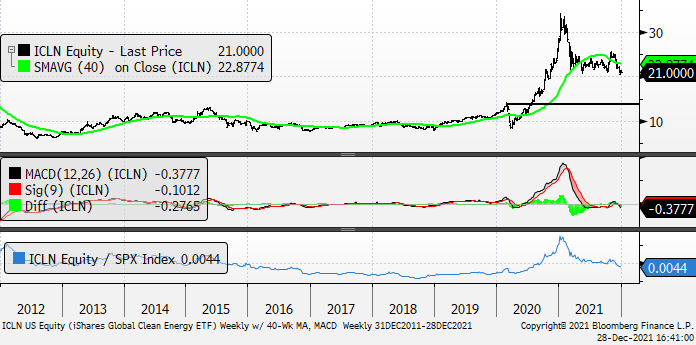
There’s nothing clean about this Global Clean Energy ETF (ICLN). Technical negatives include – below downward-sloping 40-week moving average, negative weekly momentum, and bearish action relative to the S&P 500. We are looking for support at 20 to break and expect it to work lower to 14. However, and this is not hyperbole, to see it under 10 won’t be a surprise.
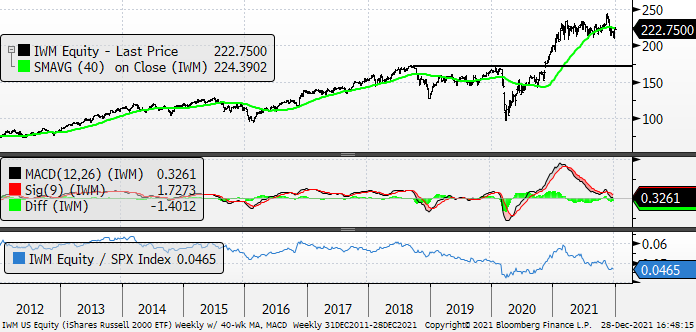
The IWM has a Technical Score equal to 2, Neutral, so it is not as bad as the other six ETFs in our table above. However, there are important negative price inputs for it, too, and we believe that it is in a good spot to short here owing to near-term considerations. The negative technical inputs include – below its cresting 40-week moving average, weekly momentum peaked in February and has been deteriorating since, the breakout (it was a fake breakout, and we hate fake breakouts) in November was not close to being confirmed by its weekly MACD, and it is bearish relative to the S&P. We like this as a short right here as well because investors / traders can use a tight stop of 228 (yesterday’s close was 222.75) for 2% of risk while looking for a target of 200 for potential 10% reward. We like that reward to risk ratio of 5:1. Yet, we think it’s important to note – again without engaging in hyperbole – that a more important failure would imply a retracement to its November 2020 breakout level of 170.
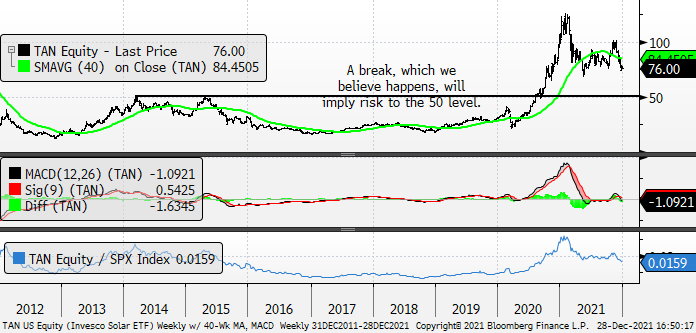
TAN is essentially the same thing as ICLN. We’re looking for support at 70 to break and believe it has risk to 50. TAN is below its downward-sloping 40-week moving average, the weekly MACD is slipping into negative territory, and its bearish relative to the S&P 500.
The XRT is not that different from the IWM in that it’s below the cresting 40-week moving average, weekly momentum peaked in March – April and has been deteriorating since and is toeing negative territory, the breakout in November was not close to being confirmed by its weekly MACD, and it is at Jan ’21 levels when compared to the S&P 500. And, like the IWM, it also engineered a fake breakout in November. Fake breakouts, like kisses, can be deadly. It’s going to have to get below 80 for it to be termed a breakdown, but we believe it will get to 80. Sell any bounce.