SUMMARY: 10yr implied real yields remain near historic lows, yet high beta and high earnings turbulence stocks remain under pressure. As we noted yesterday, sectors have turned more risk-on, but factors have not. We caution investors about putting too much emphasis on long real rates (10yr duration) in figuring out what is going on with factors. Short real rates are almost assuredly moving higher unless something goes drastically wrong with Omicron or some other shock. The intent of the Fed has shifted and they have made it clear they want real rates higher. The real rate they can control is the real fed funds rate. A higher real fund funds rate favors large cap stocks, cash returns, Value and high quality. It is negative for low liquidity, high momentum and earnings turbulence (the stuff that underperformed yesterday and never bounced).

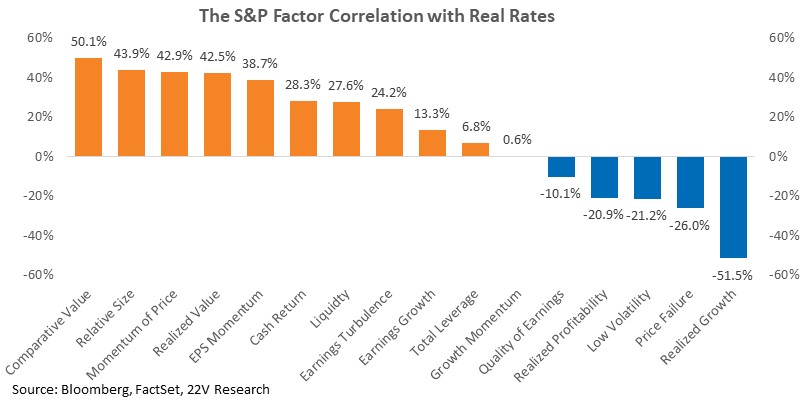
There is an important difference in factor correlations between real fed funds and 10yr real yields. When 10yr real rates go up, Quality, low volatility and Profitability factors underperform, the opposite of what happens when real fed funds increase (the rest of the factor perform roughly the same with 10yr real yields and real fed funds). We are going to do a deeper diver on this subject, but our guess would be that as the 10yr yield becomes more competitive with other assets, like high quality stocks, that those names suffer on a relative basis as 10yr real yields increase. If 10yr real yields increase because economic risk is lowered, that likely helps some of the lower quality names as well.
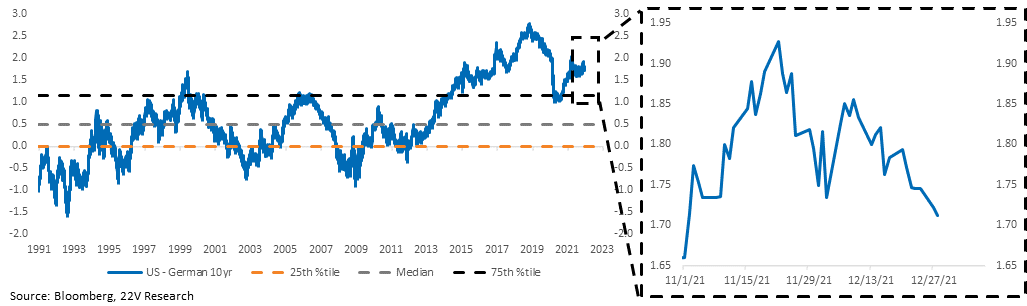
We also highlight some upside risk to 10yr yields next month as German yields have gone from -39bp to -22bp in just 12 days. Less negative yields in Europe alleviate SOME headwinds for US 10yr yields.
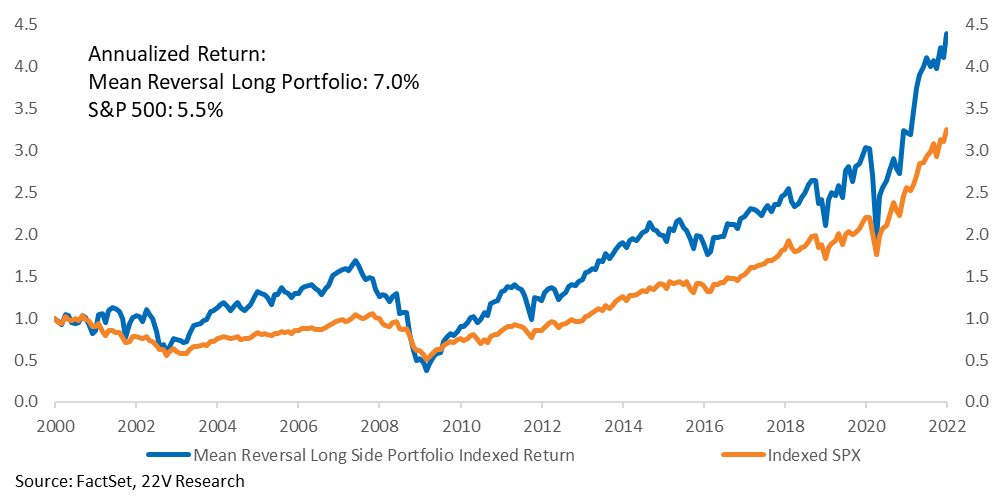
Mean reversion has been intense at the industry group and stock level (not as much at the factor level). As we highlighted in a Quant note today, a S&P mean reversal portfolio that is long the bottom 100 stocks from the previous month and short the top 100 performers has done very well. It has posted a 7% annualized return, exceeding the S&P’s 5.5% return since 2000. This year the long portfolio performed extremely well, gaining 36.8% YTD.
MARKET VIEWS: 10yr implied real yields remain near historic lows, yet high beta and high earnings turbulence stocks remain under pressure. As we noted yesterday morning, Sectors have turned more risk-on, but factors have not. That pattern roughly continued yesterday (although some Defensives and Cyclical sectors outperformed yesterday, it wasn’t just cyclical). We would caution investors about putting too much emphasis on long real rates (10yr duration). Short real rates are almost assuredly moving higher unless something goes drastically wrong with Omicron or some other shock. We will continue to emphasis that investors need to position for higher real yields and the higher real fed funds rate seems obvious. As that happens it will favor large cap stocks, cash returns, Value and high quality. It is negative for low liquidity, momentum and earnings turbulence (the stuff that underperformed yesterday).
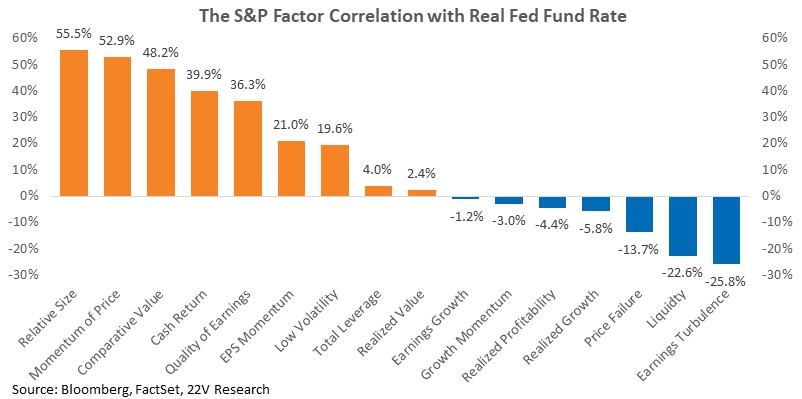
FYI…the factor correlation with 10yr real yields is different in important ways relative to the factor correlations with real fed funds. In short (and we will be doing a deeper dive on this), when 10yr real rates go up, Quality, low volatility and Profitability factors underperform. Our guess would be that as the 10yr yield becomes more competitive with other assets, like high quality stocks, that those names suffer on a relative basis as 10yr yields increase. If 10yr yields increase because economic risk is lowered, that likely helps some of the lower quality names as well.
There is some risk that 10yr real implied yields move higher though. Lower economic uncertainty as Omicron risk fade should lead to some re-rating higher in 10yr yields. It is already happening in Europe as German 10yr yields have gone from -39bp to -22bp since 12/17. Less negative yields in Europe alleviate SOME of the headwinds facing 10yr yields.
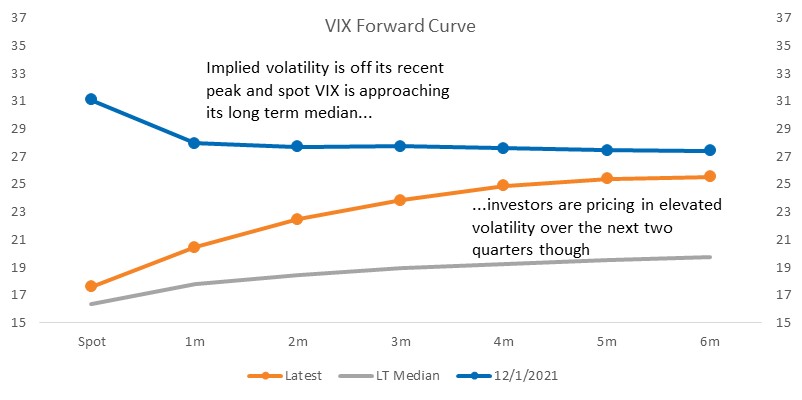
Our call remains that the skew on inflation, bond yield, and rate hikes in 2022 is higher not lower, than current expectations. Inflation and rate hikes, in particular, are dependent on highly unpredictable productivity gains, adding to uncertainty about the macro outlook in 2Q22 and beyond. Based on the forward VIX curve, investors appear to be pricing in some of that uncertainty. Spot implied equity volatility has fallen back toward its long-term median of ~17. Forward VIX contracts, however, are trading well above their typical level. The decline in near term volatility should favor mean reversion, which is something we have harped on. The worst performing industry groups in December have been Autos, Retailing, Banks, Semi, Consumer Durable and Communication Services. These industry groups are more likely to rebound in January if the mean reversal trend remains in place.
As we noted in a report today, a mean reversal strategy has also been effective at the stock level. We constructed a S&P mean reversal portfolio that is long the bottom 100 stocks from the previous month and short the top 100 performers. Back test results show the strategy outperformed, especially the long side, which has posted a 7% annualized return, exceeding the S&P’s 5.5% return since 2000. This year the long portfolio performed extremely, gaining 36.8% YTD. See today’s report for the current list of worst performing stocks MTD.