
Our entire repository of COVID charts is HERE.
Gallup released its latest poll of Americans’ assessment of the COVID situation. More respondents believe the COVID situation is improving or staying the same and less respondents are reporting things are getting worse since before the delta wave. Actions are corroborating sentiment; Apple mobility, OpenTable data, and TSA checkpoints are all near post-pandemic highs. Kastle’s back-to-work barometer, which measures office check-ins, is a laggard. WFH may be a more permanent fixture of post-pandemic life, which isn’t exactly breaking news.

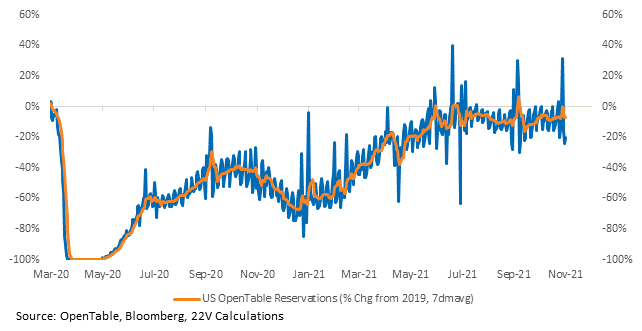
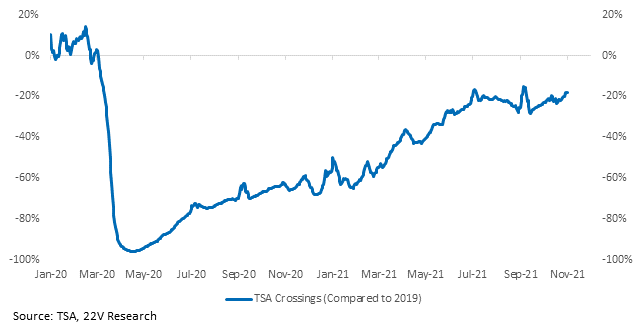
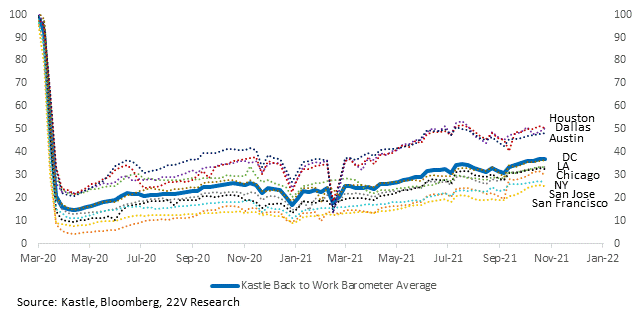
The improvement in sentiment comes as case growth has increased. We are not trying to predict the path of case growth, but would note that activity remained elevated through the delta wave. And that is a trend we expect to prevail if case growth does increase again. Vaccinations allow somewhat normal activity to persist by delinking case growth and severity (hospitalizations and deaths) for the majority of the population and almost all those most at-risk. Plus, vaccinations for children are set to begin. That may help the U.S. avoid a spike in case growth in younger cohorts akin to the UK.
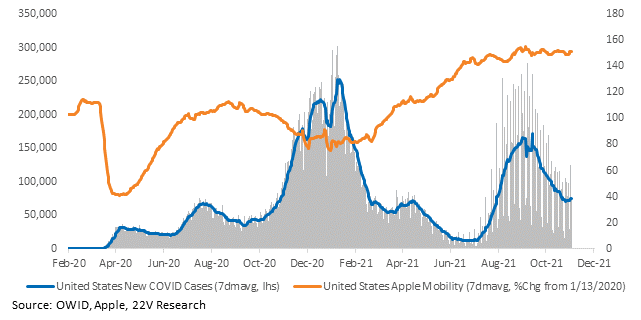
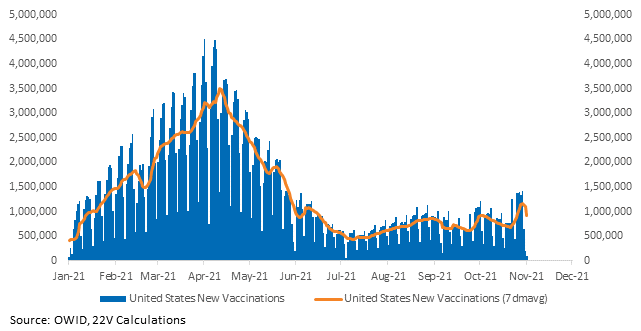
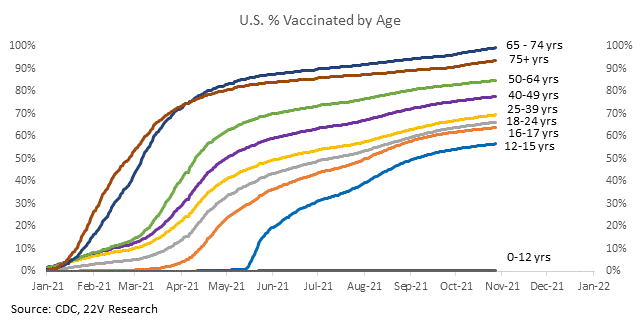
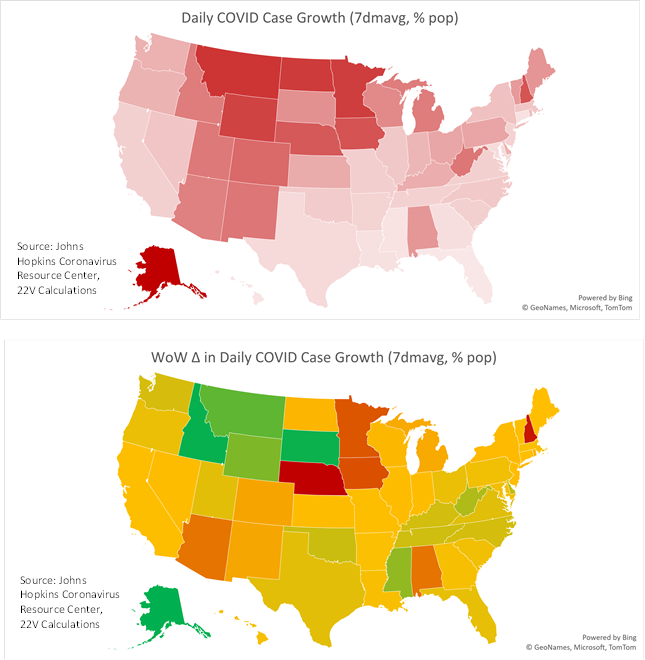
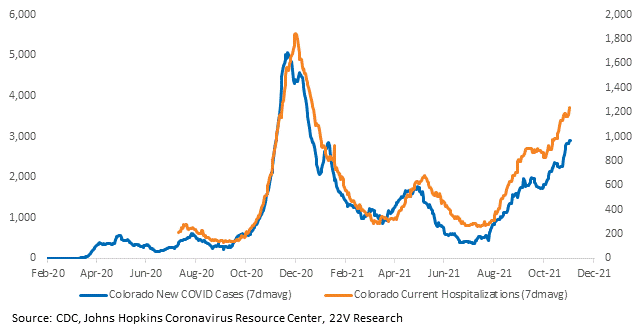
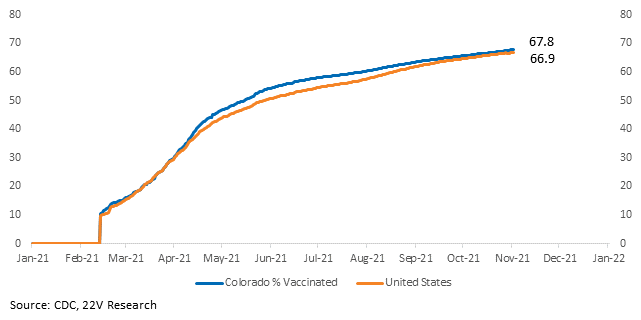
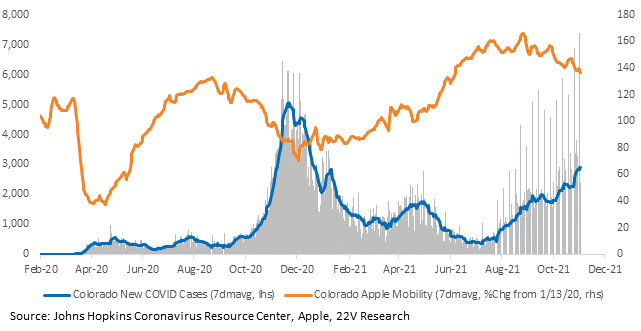
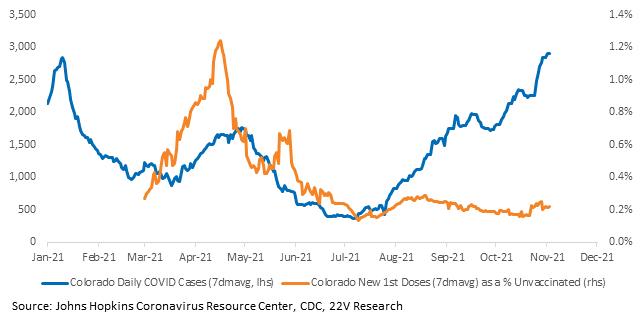
Colorado is sounding the alarm on rising cases and hospitalizations. It’s vaccination rate is a little better than the country-wide level and mobility is still near a post-pandemic high (mobility will decrease as winter arrives). New administered vaccine doses are low and stagnant. That should pick up as children are vaccinated.
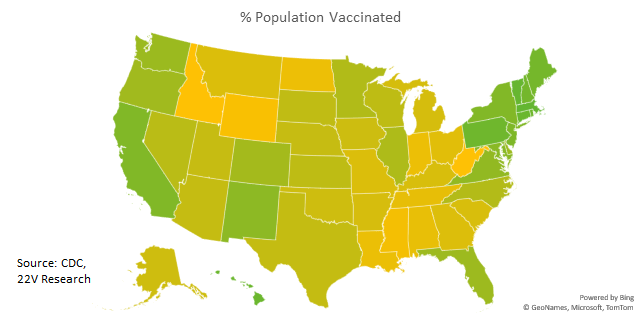
Here is a heatmap of state vaccinations.
Supply chain pressures are likely easing. Nike announced all its Vietnam production is back online. COVID trends are improving across important supply chain countries; case growth is lower, vaccination rates are high, mobility is recovering, and government-imposed restrictions are easing.
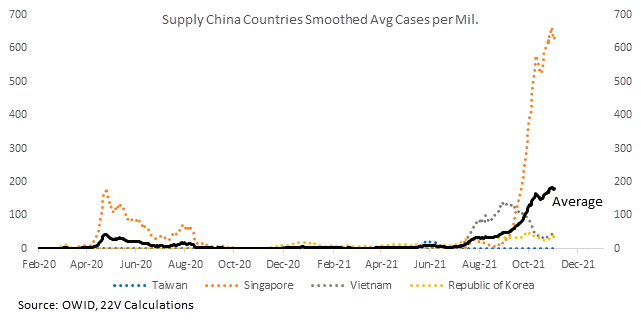
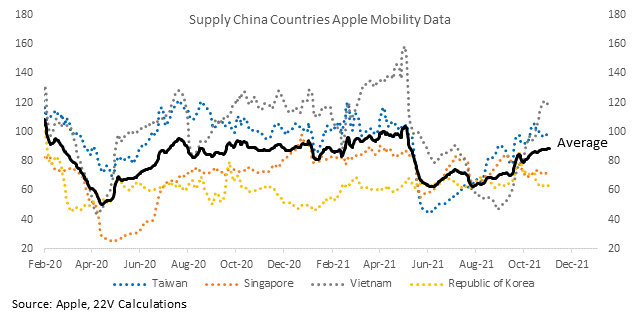
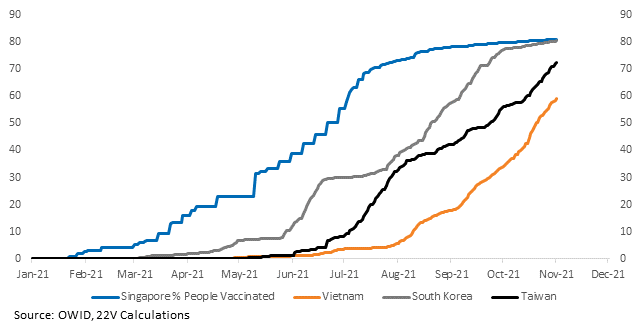
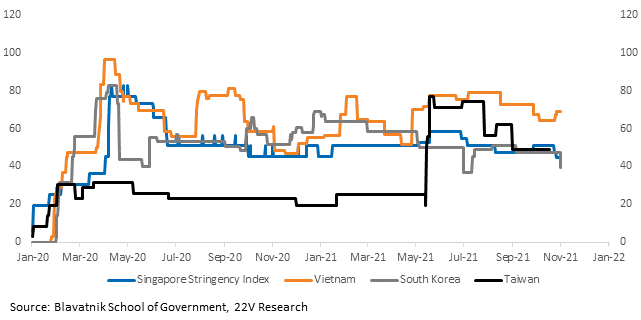
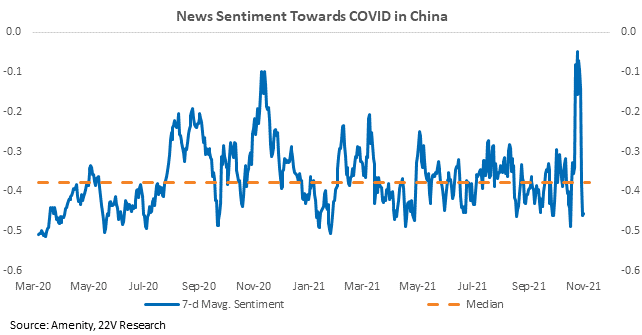
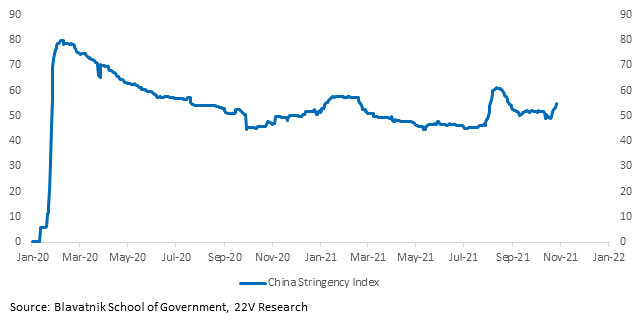
Bloomberg reported China’s outbreak is its most widespread since the first wave. Keep in mind ‘widespread’ is not indicative of how many cases there are. Scary headlines about lockdowns in China continue to surface. News sentiment towards COVID in China has plummeted. The latest headline to hit was that authorities in China are now advising people to stockpile food. Data about China’s COVID situation is opaque. We are following stringency indices put together by the Blavatnik School of Government at Oxford to gauge how disruptive policy is, rather than guess based off of headlines. China has become more restrictive over the past couple of weeks, but not even as severe as in August of this year.
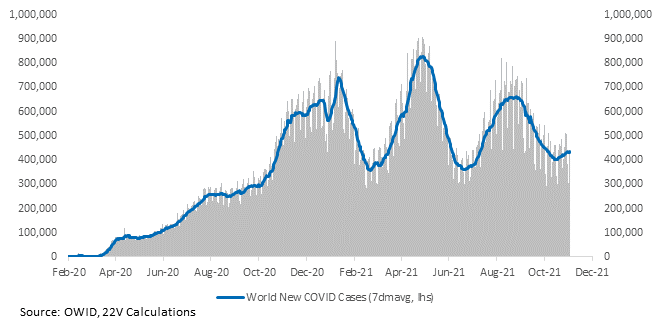
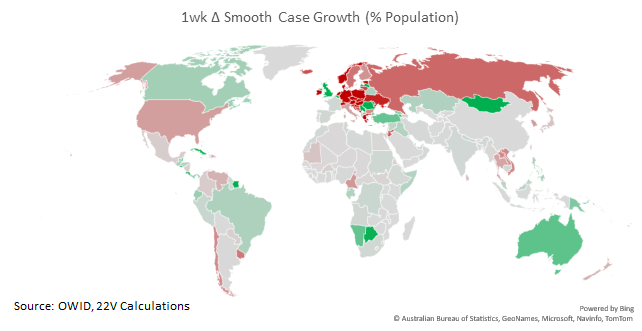
Global case growth is marginally higher and still concentrated in Eastern Europe and Russia.
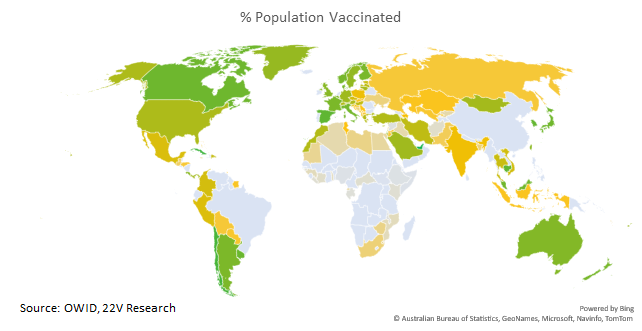
Charts for every state and country we have data for are HERE.

