

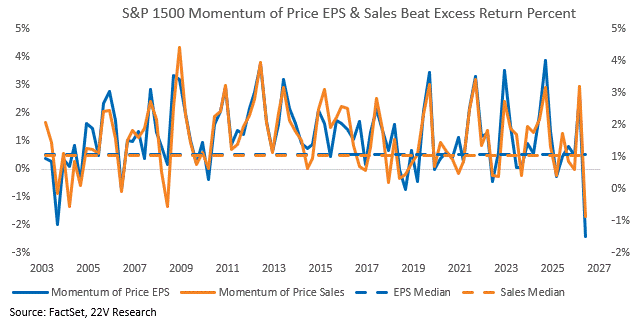
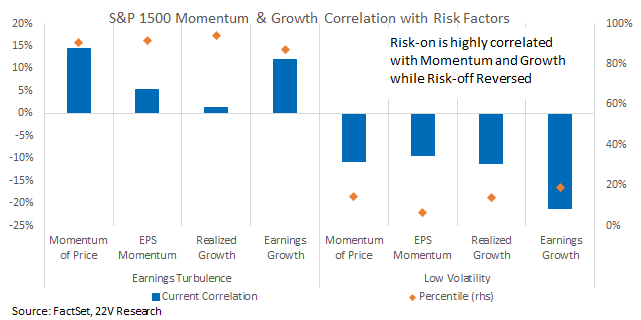
DAILY STRATEGY: Main Point – We Remain Long Risk-On vs Risk-Off Factors. Despite Risk-on factors typically facing more headwinds relative to Risk-off in a tighter financial conditions backdrop. Two main reasons. 1) Momentum and Growth factors, which have unusually large exposure to AI beneficiaries, currently have extreme overlapped with Risk-on factors. The current correlation is around its 90th %tile. We are long AI winners, Momentum and Growth factors. AI exposed companies’ earnings are likely to hold up as non-AI related Cyclicals EPS slow on a RELATIVE basis. Thanks to the MILD restraint applied to economic growth by the Fed. 2) In 2Q, high Price Momentum names had a record high EPS beat rate (85.2%) and a record low median excess return for beats (-2.4%). The median excess return was UNSUALLY poor. That is highly unlikely to repeat. The chart immediately below is eye-opening.
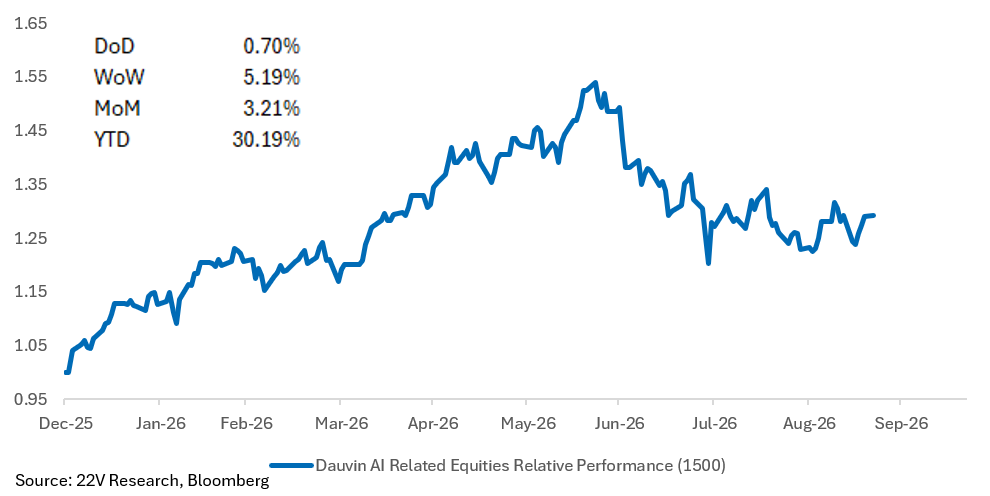
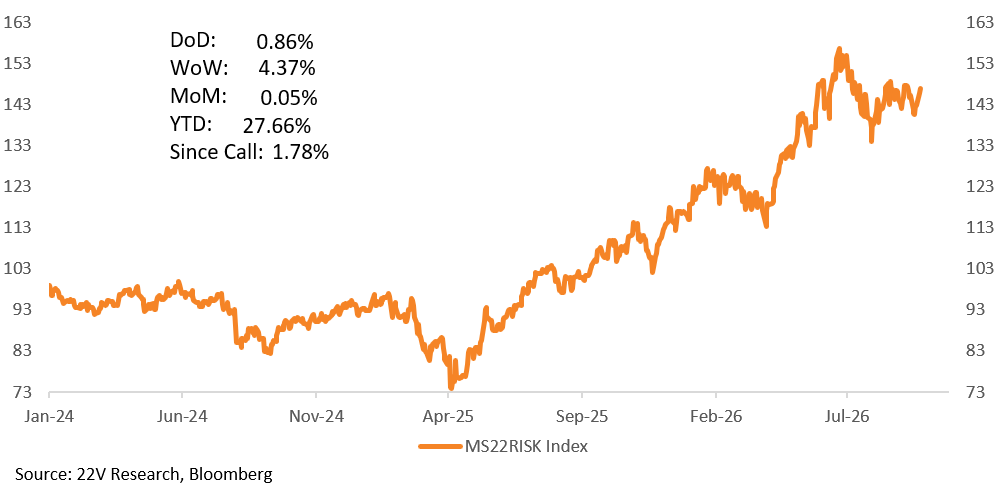
Related, as 22V Data & Infrastructure Dauvin Peterson’s pointed out in a report last Friday (HERE), across a curated universe of 81 AI capex-exposed companies spanning 12 market segments Dauvin found next-Twelve-Months (NTM) EV/EBITDA multiples compressed by an average of 26.1% from their peak levels earlier in the year*. Earnings growth Over the same period increased. FY2 EBITDA consensus estimates rose by an average of 12.3% (with NTM EBITDA up 20.8%) and that Valuation is more attractive relative to history. The 81-company group trades at an average NTM EV/EBITDA of 14.9x, which is 1.14x their pre-2026 historical average (13.4x between 2022 and 2025). We are long the 81 stocks that Dauvin highlights in particular (reach out for the list) and the Risk-On Factor vs Risk-Factor Swap in general. MS22RISK Index on Bloomberg. This swap is tradable with our friends at Morgan Stanely.
FYI – Low Volatility or Risk-off factors stock rank correlations with Growth and Momentum factors are usually low (below the 20th%tile). With credit spreads tight and inflation expectations anchored, we would not expect Low Volatility factor performance to improve much. Much more hawkish than expected data could change that.
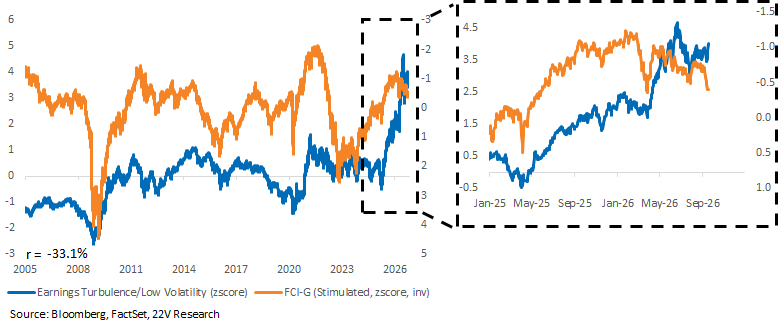
There has been a divergence with historical pattern that at factor level, Earnings Turbulence outperformed Low Volatility post the Fed meeting even as financial condition tightened meaningfully. Historically tightening financial conditions are a tailwind more to Low Volatility given risk factors relative performance is negatively correlated with the FCI-G Index. The risk-on outperformance is also diverged from factor return post historical first Fed rate hikes.
Some details from Dauvin report…PE compression by segment.
Valuation multiple compression hit the following segments hardest from their peaks:
- Memory: -41.5% multiple compression (FY2 EBITDA +29.1%)
- Neocloud: -39.0% multiple compression (FY2 EBITDA +12.4%)
- Electrical Components / Services: -34.3% multiple compression (FY2 EBITDA +20.9%)
- AI Materials: -32.5% multiple compression (FY2 EBITDA +4.4%)
- Engineering & Construction (E&C): -30.8% multiple compression (FY2 EBITDA +8.2%)
- Onsite Power: -27.0% multiple compression (FY2 EBITDA +2.9%)
- Thermal Management / Liquid Cooling: -25.6% multiple compression (FY2 EBITDA +5.9%)

