

- Looking at analogs to today’s environment relative to past rate hiking cycles, our quant team scored the 2016 hiking cycle as the most similar (below).
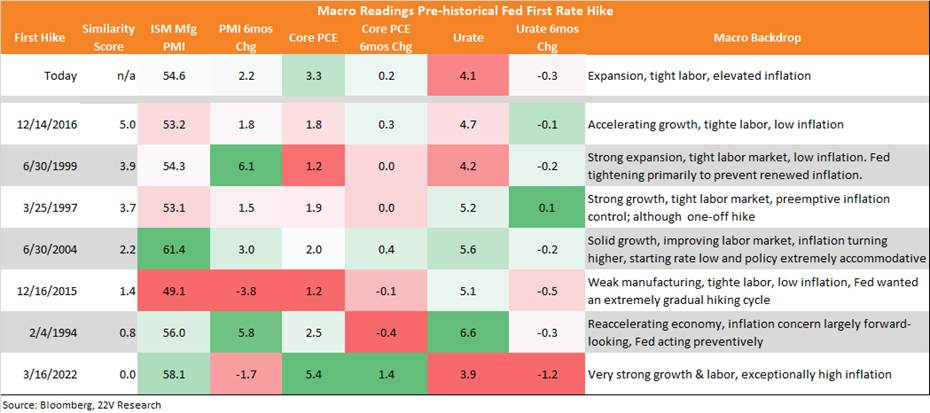
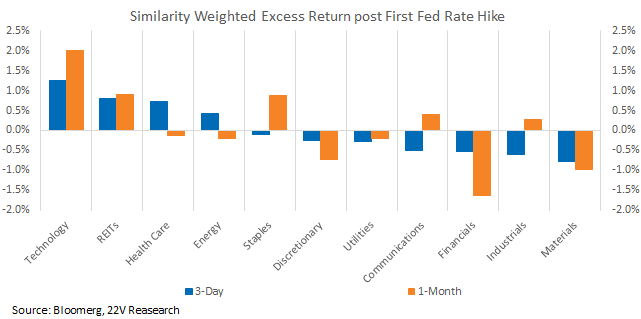
- The team then weighted the historical excess returns across the different cycles based on their macro similarity and aggregated them together. Technology remained the leading sector, while Defensives including REITs, Health Care and Staples also performed relatively well. Materials and Financials saw more downward pressure.
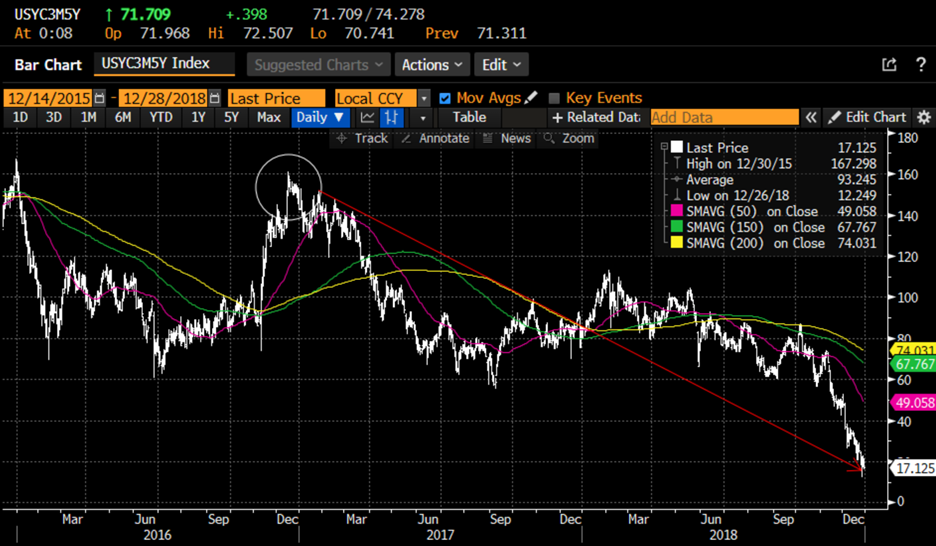
- If 2016 is in fact the best analog, we wanted to look at what the yield curve was doing at the time and for the few years post, and see how it matches up to today’s starting point. First, it’s important to remember that December of ’16 was the beginning of the first rate hike cycle since the Financial Crisis and it largely continued slow and steady through 2018. As you would expect, coming off ZIRP policy after such a period of time, the curve was naturally quite steep (see below). After 2 years of steady hikes, the 3M-5Y curve essentially flattened from 150-160 bps to almost flat over the course of ~8 hikes.
Source: Bloomberg
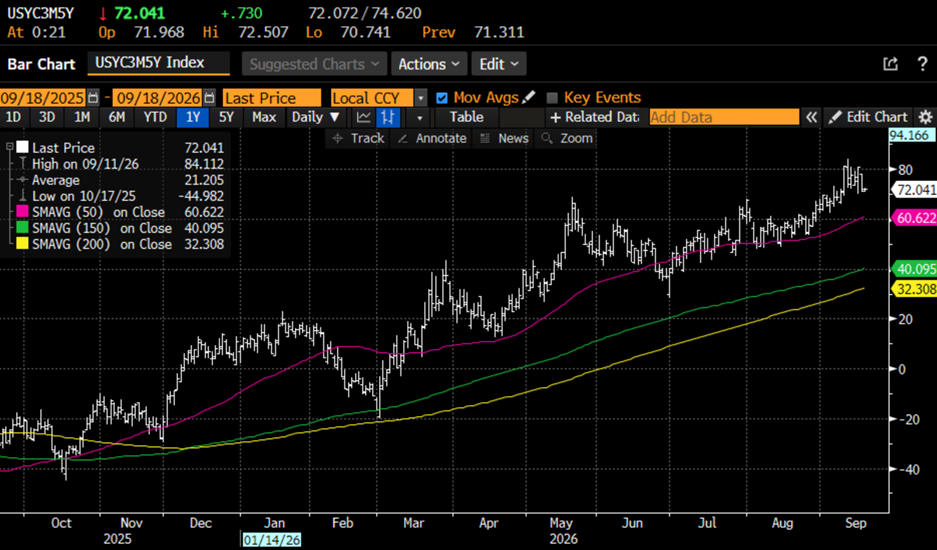
- Fast forward to today, and we ‘re more in a mid-cycle corrective phase but coming from a 3.5%-3.75% starting point rather than 0-0.25%.
- The big question from here is whether or not the Fed hikes in the 2x-4x zone, or does it eventually take something much more aggressive akin to 2016-2018 – only time will tell. While only about half the original starting point (70-80bps vs. 150-160bps) we’ve been trending higher over the past 2 years. Again, the persistency of inflation and how quickly the Fed can get things under control will be the ultimate arbiter.
Source: Bloomberg
Conference takeaways:
- For the regional banks, the conference was almost (ex-HBAN) universally positive with banks either reiterating guidance or guiding to the high end of the recent ranges given out at 2Q earnings.
- We felt like Fifth Third’s guidance to the high end of the NII and fee ranges and the low end of the expense guide combined with their asset sensitive tilt make it a solid core name going into this rate cycle.
- US Bancorp guided higher intra-Q for the 3rd quarter in a row with NII at the high end, fees at the high end or a bit better and expenses in line. We continue to believe in the margin improvement story and over time greater capital return (albeit not this Q).
- On the flip side, while Truist did part with their Regional Acceptance business which is NII/NIM reducing but eps enhancing given a lower provision, the more hawkish Fed may be an increasing headwind to their swap portfolio if there are 3-4 hikes in total. While Truist had a hike baked into 3Q, there were no others baked into the guide from here. We tend to believe that while Truist will continue to try to remix their portfolio, the current path of rates may be an inhibitor to making substantial progress quickly.
Conference tidbits:
- For the remainder of the note, we highlight common themes across 11 regional bank presenters (see below).
Universally Constructive Macro Backdrop
- All 11 companies described the consumer and commercial environment as ‘good,’ ‘strong,’ or ‘constructive’ — GDP growth expected ~2–2.5%, unemployment holding in the low 4s, no systemic delinquency deterioration.
- Consumer spending strong: WFC debit/credit spend +3–5% Y-o-Y; RF credit card +8% and debit +7%; USB consumer healthy despite FIFA spend moderation in August; FITB prime/superprime consumer base benign; MTB economy ‘very strong on all fronts.
- Commercial clients cautious but active — investing, borrowing, running offense despite rate/geopolitical uncertainty; MTB CEO Jones says 2026 is ‘one of the most robust markets I’ve seen in a long time’ for C&I.
- Rate environment shifting: Fed expected to hike; 10-year broke 5%; most companies modestly asset-sensitive with a net benefit, offset in some cases by markets-book noise or deposit cost pressure (HBAN most impacted).
Loan Growth Moderating in 2H vs. 1H — But Demand Broadly Strong
- Near-universal moderation message for 2H; strong 1H (FITB +~12% via Comerica; WFC +12%; CFG/EWBC/KEY accelerating); full-year targets generally intact or being exceeded.
- C&I demand described as very strong across all 11 companies — the clearest unanimous positive; middle market, corporates, specialty verticals all active.
- Key headwinds in select categories: HBAN (CRE refi activity at 2x expected pace, indirect auto competition); WFC (moderating from 12% first-half pace); RF (post-Iran conflict pull-forward normalizing); WAL (deliberately moderating to fund buybacks).
- MTB CRE inflection a notable positive: CRE which had been a multi-year headwind for MTB inflected positively in Q2.
- Loan spreads broadly stable — any compression attributed to mix shift toward investment-grade/higher-quality credits, not competitive price erosion; CFG, KEY, USB all noted spreads not compressing.
NII / NIM — Divergence Emerging Between Companies
- Unlike prior conference days where all companies expressed NIM expansion confidence, Day 3 introduced a key divergence: HBAN revised 2027 NIM expectations lower due to deposit cost pressure and competitive asset yields.
- HBAN: organic loan growth run rate slowed from 8–9% to ~6%; NIM expected to track low-to-mid 3.20s rather than continuing to rise; 2027 EPS revised to $1.75–$1.83 from $1.90–$1.93.
- MTB, USB, WAL: all confident in NIM trajectory — MTB high 3.60s, USB path to 3%, WAL targeting 3.60–3.70% over 3 years.
- Universal driver: fixed-rate asset repricing continuing to benefit; 10-year at 5%+ supports securities reinvestment and swap levels across all companies.
- Deposit cost pressure a watch item for HBAN and WAL — both taking active steps (HBAN: Cadence optimization; WAL: $4B deposit transitions to optimize cost mix).
Fee Income — Broad-Based Strength (All 11 Companies)
- Fee income was a consistent bright spot: capital markets, wealth management, and payments the most frequently cited growth drivers across all 11 companies.
- Capital markets: WFC investment banking and markets +MSD YoY; CFG capital markets at record; KEY expecting 20%+ sequential Q3 growth; TFC guiding ~10% fee growth; RF/FITB capital markets recovering; MTB fee income +10% Y-o-Y; USB capital markets growing rapidly (first full BTIG quarter).
- Wealth: EWBC launching own RIA; WFC wealth advisory up significantly; CFG at records; FITB targeting high single-digit growth; RF strong; MTB Wilmington Trust exploring new wealth segments; USB trust & investments all-time highs.
- Payments: KEY low-double digits; CFG ~10%/year; FITB Direct Express issuing 40–50K cards/month; EWBC digital multicurrency FX; WAL treasury management services accelerating; USB payment transformation showing results; HBAN merchant acquiring in-house.
AI & Technology — Moving from Hype to Results (All 11 Companies)
- AI deployment broadly in progress across all 11 companies; results becoming measurable and companies more specific about use cases and ROI.
- Code development / developer productivity: WFC autonomous coding agents; RF GitHub Copilot at 80%, 30% productivity lift; FITB AI in code writing; KEY via Copilot; MTB 65,000 technology releases in 2025 vs. 15,000 five years ago; USB $5–6B platform investment over 5 years yielding productivity now.
- Customer-facing AI: FITB Jeanie chatbot bilingual (English/Spanish), activity doubled in Comerica conversion week; EWBC digital multicurrency FX mobile; WFC tokenized deposit product; USB Smartly banking suite ($84B); HBAN digital platform for customer acquisition.
- Unique company AI highlights: MTB credit underwriting anomaly detection using AI; WAL focused on top 5 of 15 identified use cases; USB Digital Asset Platform (DAP) with bank-grade compliance controls for stablecoin/tokenized deposits.
- Broader picture: CFG ‘Reimagine the Bank’ ($450M pretax benefit exiting 2028); KEY enables revenue scaling without headcount growth; WFC every function has opportunity; HBAN 9% payments CAGR from capabilities including merchant acquiring.
Disciplined Expense Management & Sustained Operating Leverage (All 11)
- All 11 companies targeted or delivered positive operating leverage in 2026; tone universally disciplined — revenue growth not being fully reinvested.
- Notable: WFC $55.7B unchanged; CFG ~4.5%; KEY ~4%; EWBC 8–9%; FITB lower end of Q3 guide (gross saves >$900M vs. $850M target); TFC and RF within guidance; MTB high end of range (investing in tech); USB at least 200 bps positive leverage; HBAN 32.5–33.5% expense ratio range.
- HBAN accelerated expense re-engineering program — nearly doubled 2027 target to help offset NIM headwinds; KEY moved ops out of tech org for better AI leverage; MTB $1.2B/year tech spend (up from $300M 6 years ago).
M&A — High Bar; Organic Opportunity Universally Preferred
- Strikingly consistent message across all 11 companies: organic growth runway is large enough that bank M&A is not a near-term priority.
- Why no bank M&A despite open regulatory window? MTB CEO Jones’ view: sellers think ‘I’ll go another two years’ given strong environment; buyers emerged but fewer sellers than expected; integration risk still high.
- WAL exception: explicitly building toward higher PE multiple before contemplating bank M&A; ‘coming inside the box’ in terms of growth profile to lower cost of equity.
- Non-bank bolt-ons active: KEY Clearwater (IB); CFG six M&A boutiques; RF Fraser Lanier (government banking); USB BTIG (equities); EWBC/WFC open to payments/tech; WAL Corporate Trust expansion.
CRE Office — Winding Down for Most; Inflecting for MTB
- CRE office most-cited credit watchpoint but characterized as manageable and improving; the more notable story is MTB’s CRE INFLECTION being a positive development after years as a headwind.
- CFG: mid-to-high 30s bps charge-offs; expected to settle once office residue clears; WFC: releasing reserves as certainty improves; EWBC: only 10 office credits >$30M ($387M total).
- MTB (positive): CRE concentration reduction complete; now seeing originations pick up while fee businesses (M&T Realty Capital, private loan placement) more than offset balance sheet reduction.
- HBAN (most acute): CRE payoffs at 2x expected — major contributor to earnings guidance revision; expects to reach concentration target ~1 year ahead of schedule, positioning for more front-footed 2027.
Capital Returns — Buybacks Active; Basel III Endgame a Common Positive Catalyst
- All 11 companies managing CET1 within or above target ranges; buyback programs active; Basel III endgame expected to provide 80–100+ bps of capital benefit in 2027–2028.
- Notable: USB paused Q3 buybacks (strong loan growth, Amazon RWA, AOCI pressure) but committed to resuming ‘shortly’ and targeting 70–75% payout ratio; WAL $150M buyback in 2H 2026 (originally $200–300M over 3 years) — aggressive opportunistic buying.
- HBAN upsizing 2027 buyback by $200M to $1.3–$1.4B as lower loan growth releases capital; MTB bought back 9% of the shares outstanding in 2025.
- Consistent capital priority framework: organic loan growth first → dividend → bolt-on capability M&A → share buybacks as release valve.
Unique Company-Specific Headlines
- HBAN: 2027 EPS guide revised to $1.75–$1.83 (from $1.90–$1.93) — only bank proactively guiding 2027 at the conference; pressures from deposit cost competition and select asset class headwinds (CRE refi, auto, resi mortgage).
- TFC: Sale of $5.5B near-prime auto loans (RAC) — non-core exit generating $945M CET1; new CEO Mike Lyons (Day 15) accelerating portfolio rationalization; ‘getting back to winning more’.
- FITB: Comerica core system conversion completed over Labor Day — ‘most complicated conversion in company history’ — described as ‘as close to perfect as I’ve seen in 27 years’; now on full offense.
- WFC: Tokenized deposit product launching in production — blockchain-based cross-border payment solution; tackles addressable market limited by lack of global branch network. NIM flat to down 1bp vs. down 3-4% although NII guide reiterated at $50bil.
- MTB: CRE inflection — years-long deliberate concentration reduction now complete; CRE EOP +5% QoQ in Q2, strongest average loan growth quarter since 2012; fee businesses from CRE (M&T Realty Capital) more than offset balance sheet reduction.
- USB: BTIG first full quarter in run rate Q3; Digital Asset Platform (DAP) announced — building tokenized deposit/stablecoin infrastructure with bank-grade compliance; approaching CAT2 regulatory threshold (~$700B).
- WAL: Strategic pivot from growth maximization to profitability optimization; $4B deposits transitioned out in 2026 (ahead of $3B goal) while still growing deposits; buying back $150M+ shares as stock trades below intrinsic value.
- EWBC: Launched own RIA product this quarter after unsuccessful wealth M&A search; FX digital transformation toward real-time multicurrency mobile capability; DDA floor identified at 24–25% of deposits.
- RF: Deposit system transformation (7-year project) entering friends-and-family pilot next month — major technology infrastructure milestone; new CFO Neil Roth making debut.

