DAILY STRATEGY: Main Point – For those looking for direct MACRO signals on what would cause a larger and more sustained drawdown in the Price Momentum Factor and YTD S&P 500 winners, keep an eye on the 2yr yields. If the 2yr yield breaks meaningfully above the 4.2% level (so heading toward 4.3-4.5%) it would likely be associated with hawkish economic data that forces the Fed to hike rates. The drawdown could be severe given the unusually high level of volatility in the concentrated group of YTD S&P 500 winners and the Price momentum factor.
If 2yr yields remain around current levels (just below 4.2%) or move lower, the macro case for a Price Momentum correction will be less compelling. Concentration of winners has been more positive than normal for forward 1 week and 1 month returns historically. This assumes 2yr yields lower in a benign slowdown of economic growth in 2H26 (our macro call). A recession driving 2yr yields lower would be very bad for the price momentum factor.
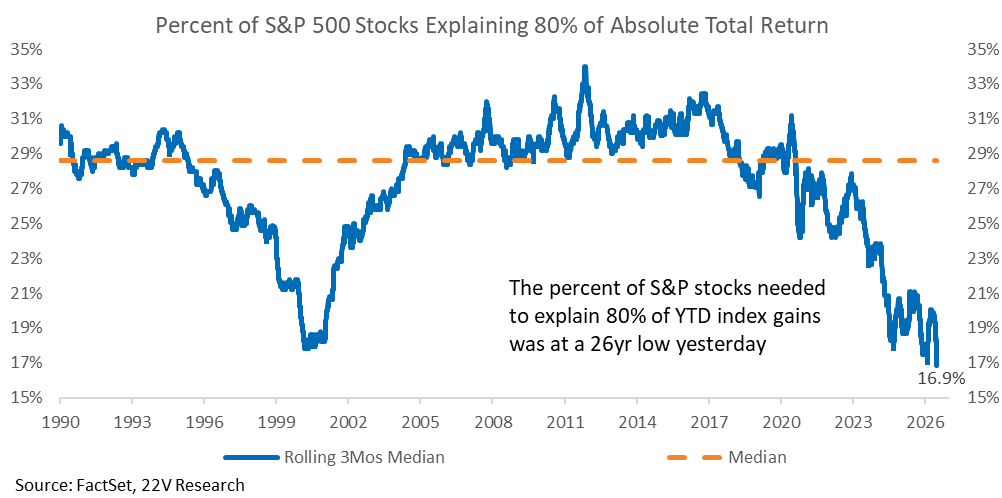
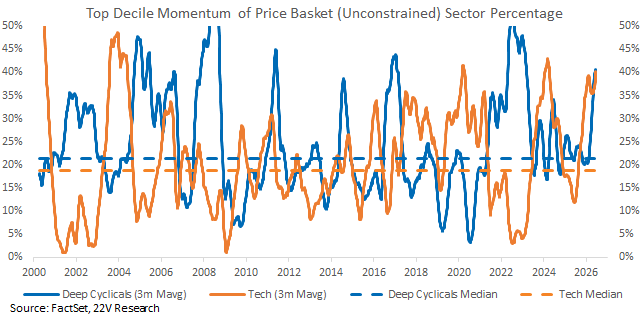
Some Stats to Start – Just 16.9% of S&P stocks (by count) explain 80% of YTD index returns. That is the lowest reading since 1990 and below the Dot Com reading. Contributions from Price Momentum confirm the concentration of returns. The rolling 3mos average of Tech and Deep Cyclicals (Energy, Materials, and Industrials) account for roughly 40% of top decile Price Mo names.
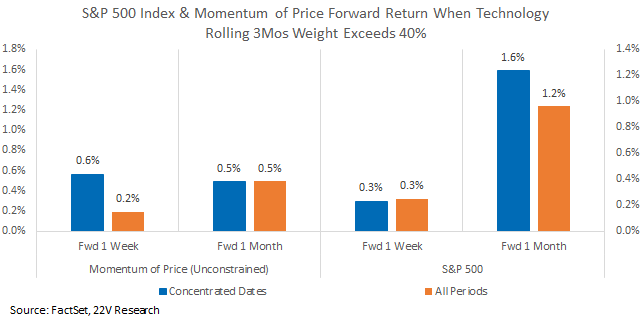
The above stats are trivia unless we have some data and or logic to how the market and price momentum factor will trade going forward. First off, just being short because of market concentration is a bad strategy. When Price Momentum is being driven by a narrow set of names, forward 1 week and 1 month returns have been better or roughly in line with all periods for both the Price Mo factor and the S&P Index.
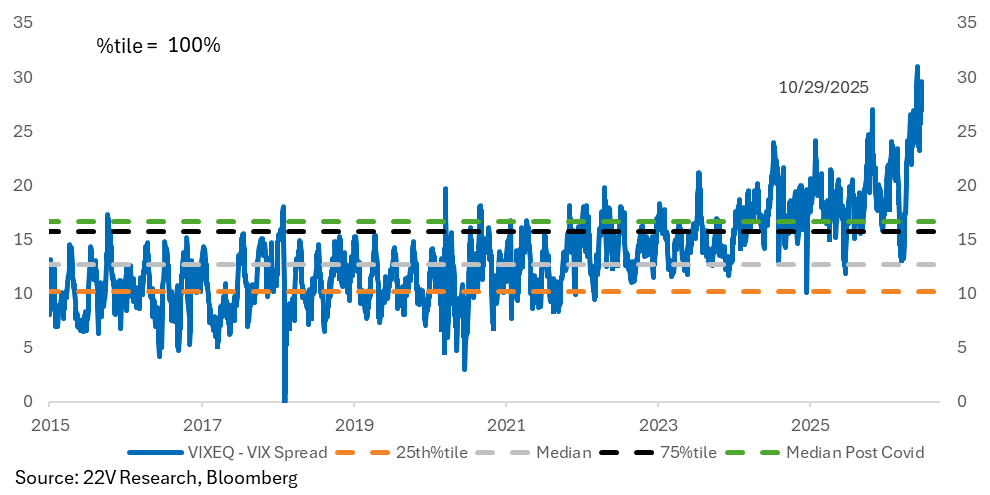
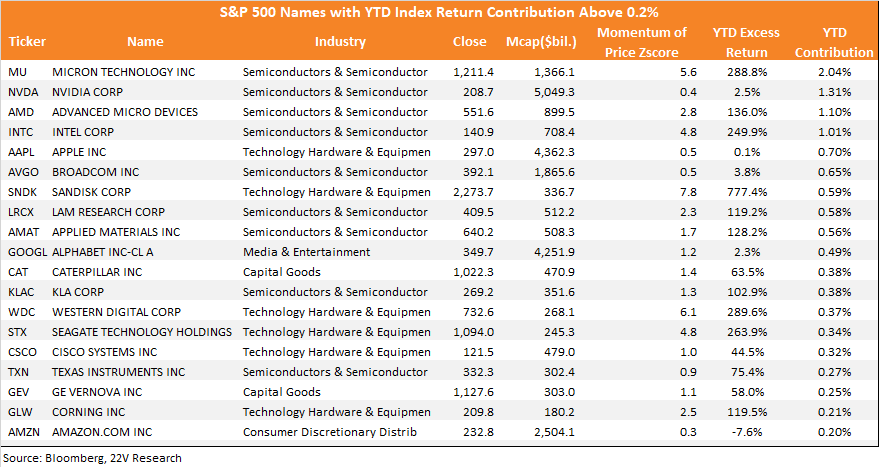
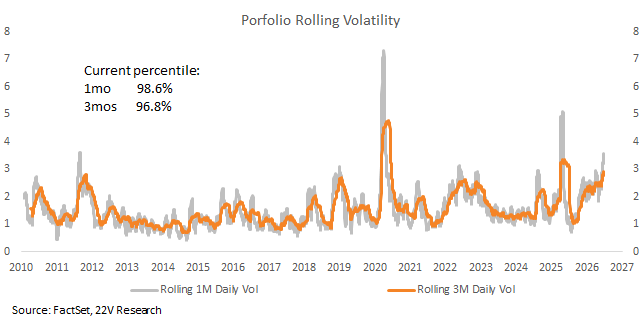
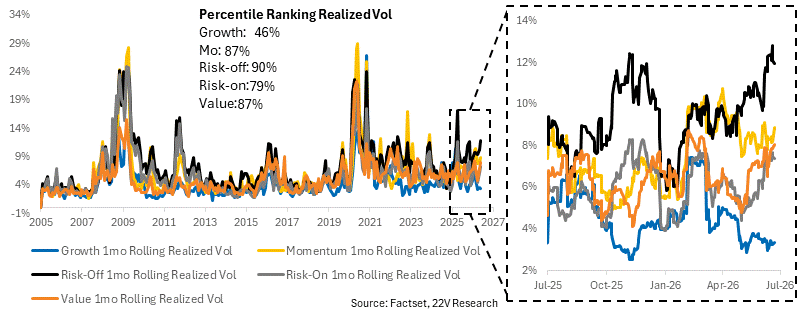
What is likely this time is the concentration in volatility. The S&P 500 names that have contributed the most to S&P appreciation this year (list below) have 1mo realized vol in the 99th%tile going back to 2010 and 97th%tile on a 3 mos basis back to 2010. The price momentum factor vol is above the 95th%tile and single name stock vol is at the highest level ever relative to S&P index vol.
The extreme level of volatility in YTD winners makes it difficult to manage risk. That is why Jeff Jacobson, head of 22V Derivatives Strategy has suggested hedging long Price Momentum exposure with IWM (Small cap etf whose returns are being driven by AI winners) or buying a put spread for MTUM (Momentum ETF) , which has exposure to Momentum and covers most names in the list of stocks that have contributed most to YTD returns (HERE). If not hedging, keep an eye on 2yr yields.
Charts below
Concentration of returns is at an extreme.
Price momentum is being driven by a smaller group of sectors that are exposed to the AI buildout.
History suggests that such concentration does not necessarily signal an imminent reversal. When Price Momentum is being driven by a narrow set of names, forward 1 week and 1 month returns have been better or roughly in lined with all periods for both the Price Mo factor and the S&P Index.
List of stocks that have contributed the most to S&P returns YTD.
The volatility of the S&P YTD winners is unusually high.
Risk on and Risk Off factor vol is at unusually high levels. Growth factor vol is low.
Single stock vol is at the highest level ever relative to index vol.