Back Banks

Bank Strategy – Rotation and the Deposit Debate

Published on June 5, 2026

∙ Download the PDF Report

By

Bill Hebel

Brian Herlihy

  • Post the Bernstein conference last week, we wanted to circle back on the topic of most of our conversations this week (deposit costs) and also incorporate some thoughts on how to frame the debate as we stare down the last big conference of the Q (Morgan Stanley Financials Conference) on June 9th & 10th.
  • If last week’s conference is any guide, the major topics will be investors’ concerns around deposit pricing offset by an upbeat backdrop for both capital markets activity and loan demand and consistency in consumer spend trends. As it pertains to stock performance, the clearest trend relative to last week’s presentation has been the outperformance of the universal banks and brokers relative to the regionals.

Thoughts on the Group:

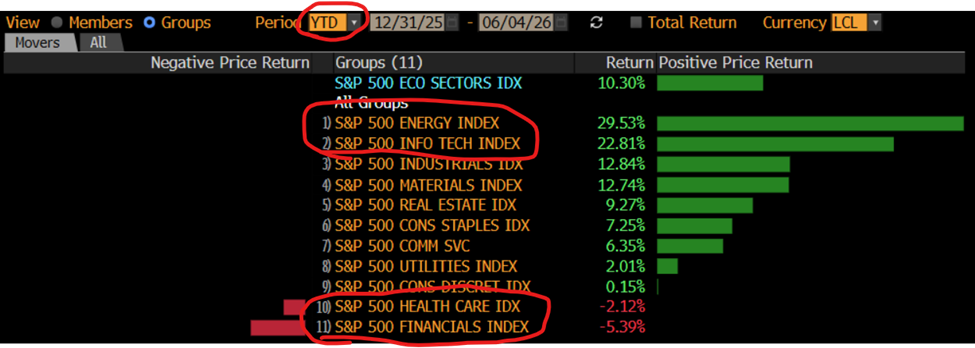
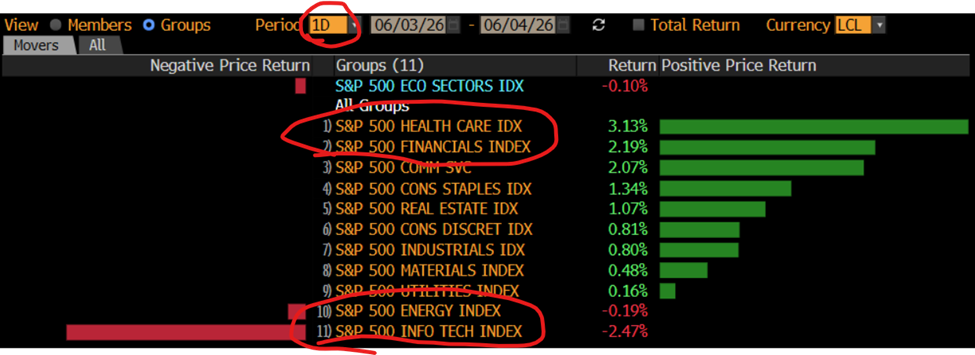
  • From my interactions over the last few weeks, the sentiment has felt decidedly more bearish. Ostensibly, the deposit cost theme has been the bugaboo for most everyone, led by concerns around a.) funding loan growth, b.) stablecoin (Clarity Act), and c.) Agentic AI optimizing idle cash which all culminates in d.) the resulting deposit mix shift to more interest-bearing funding sources to either fund growth or “defend your turf.” While all topics I want to address, all of these concerns also coincided with bank stocks acting poorly in tandem. Therefore, it was the cause of it. “Post hoc ergo propter hoc.” After this, therefore because of this” for all of you old “West Wing” fans. What was the moral of Jeb Bartlett’s story in that episode? The brain likes a simple equation of causation, but sometimes the brain can overread or jump to the wrong conclusion. I’ll show it to you in 2 charts.

Source: Bloomberg

Source: Bloomberg

  • The 2 charts are from mid-day yesterday post the Broadcom (AVGO) quarter and resulting washout in semis and “growth” writ large relative to the YTD performance of the top 11 GICS sectors. Regionals are up ~3% today as I write this on “no new news.” So has the driver of the recent underperformance been solely because of deposit pricing concerns or because of the narrowness of money flow into a very few sectors at the expense of poor financials? The answer (at least in my mind) is clearly both, but the magnitude and the sentiment shift felt a little like the fallacy of “Post Hoc Ergo Propter Hoc.” While deposit costs/mix shift are a legitimate headwind, maybe investors were letting the sector rotation drive a more negative view on the stocks than they deserved? I’ll leave it to the reader to decide, but it feels like it’s at least partially true.

Deposit Costs – The Elephant in the Room

  • Setting the Jeb Bartlett Latin lesson aside, deposit mix shift is a legitimate concern and I think about the concerns in the buckets of shorter term vs. longer term headwinds.
    • On the longer-term front, I’m going to put stablecoin in that bucket. Given the turmoil amongst the Republicans post primaries, the lateness of the legislative session and the lobbying from the smaller banks represented by the ICBA, Kim Wallace tends to believe that Clarity Act enactment this year is unlikely. Given where Congress may be from a party in control standpoint come November, if it doesn’t make it into this legislative session, it could be 2028 before we have the next substantive legislative conversation.
    • Agentic AI would be the next concern which I’d put more in a “medium term” bucket. The thought process here is that an AI agent would optimize your idle non-IB deposits and/or deposits that are earning a below average rate into a higher yielding CD or money market account. That does make some sense to me, but from a practical perspective I believe adoption would take some time. In addition, while there may very well be an addressable market, I would tend to think that the “TAM” would tend to be high net worth/small to maybe medium size businesses. If the deposits are too granular or truly transactional based, the economics won’t make much sense. If the deposit base is too big/too sophisticated with a CFO/corporate treasurer, it’s likely that they’re already participating in some type of treasury sweep. It’s those in the “middle” where an AI Agent may have a true value proposition over time.
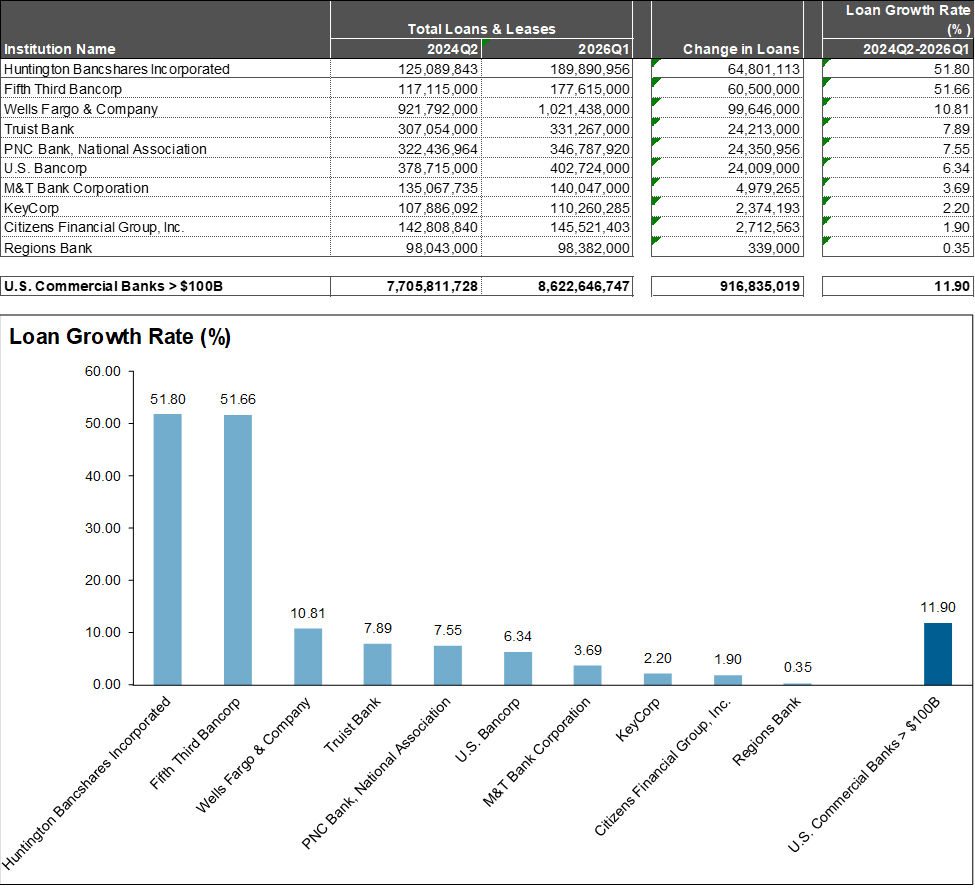
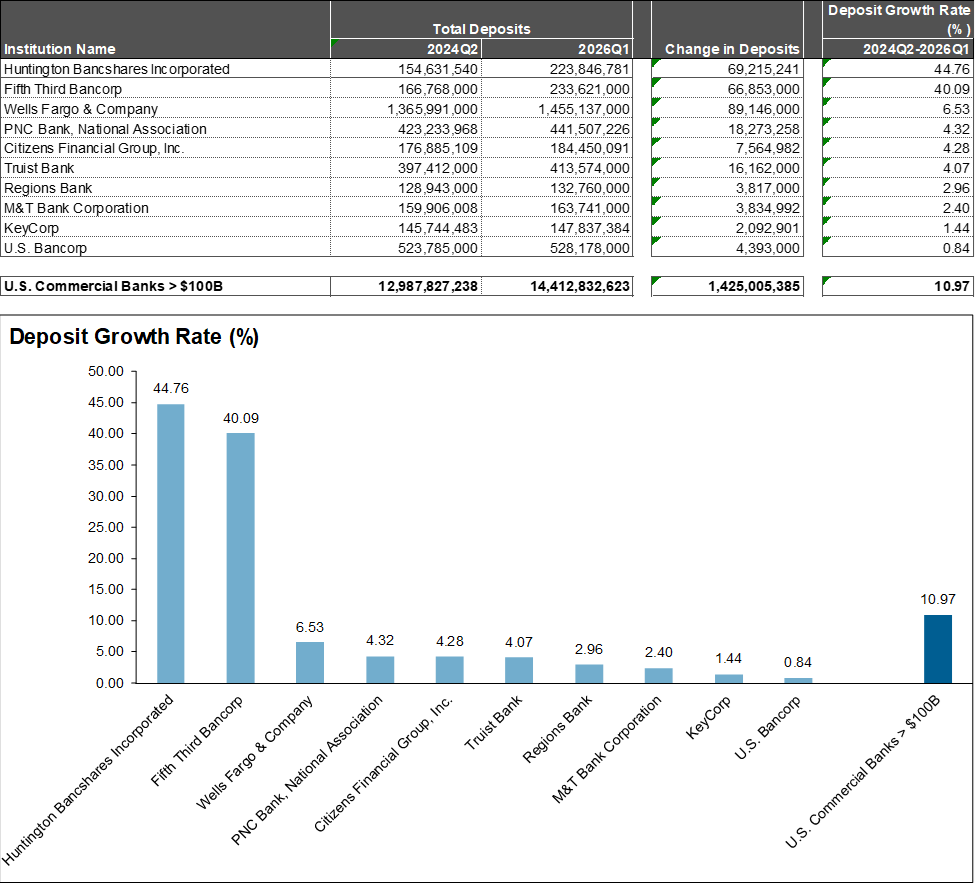
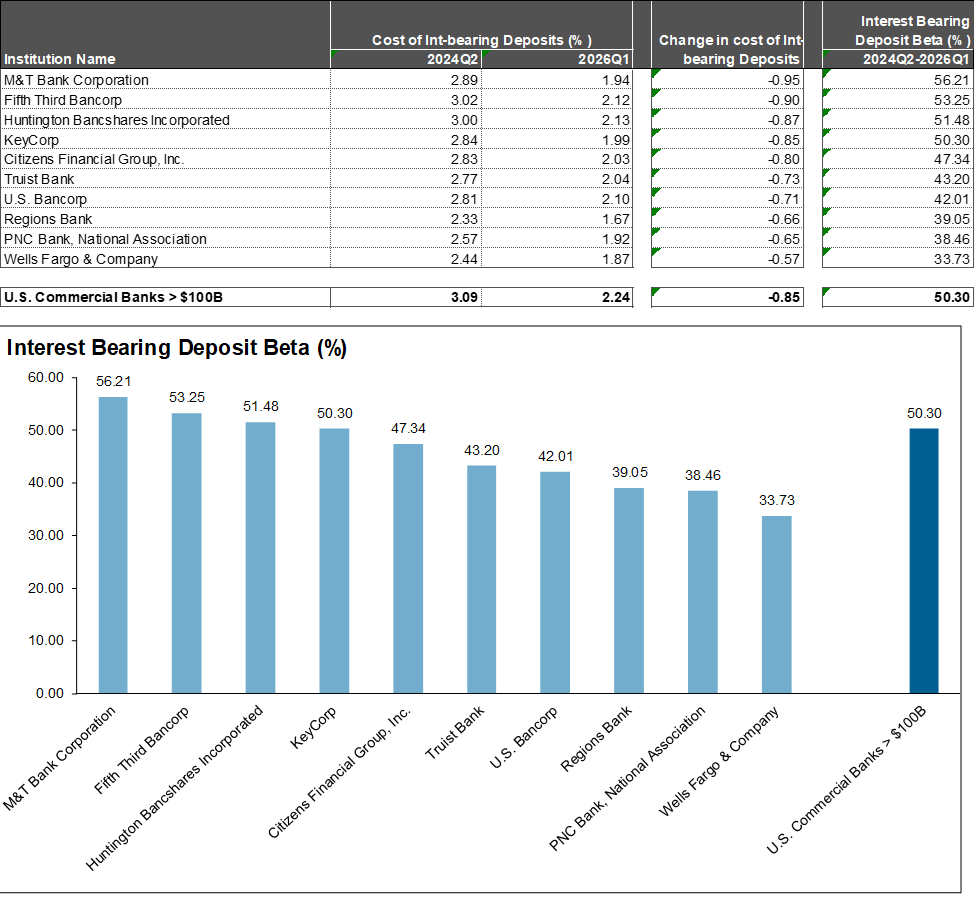
    • Over the near term, the H.8 data indicates that loan growth has remained strong with total loans up ~2.8% “quarterized,” total C&I loans up 5.1% but total deposits up ~1.4%. But within that deposit growth, non-time deposits are up only 0.6% while large time deposits are up 11.6% and borrowings are up 13.5% (all “quarterized”). In short, it’s this mix shift that has investors concerned. With the Fed now on hold, and the investment community used to following guidance on incremental/cumulative betas, we find ourselves working without a net so to speak on the rate of change in the absence of any movement in rates. So how do we crack the code on which banks are going to feel the deposit pressure soonest/most acutely? While not a straightforward exercise, we believe that individual business mix and growth strategy, along with the trends from Q2’24 to 1Q’26 can provide a window into the go forward. For the exhibits below, the observations we make set aside HBAN, FITB, and PNC where the data is skewed from their recent M&A. That said, let’s look at some of the non-M&A impacted names who spoke last week:
      • WFC (Sector Underperform) – Has been growing loans aggressively post asset cap removal predominantly C&I through the investment bank. They have also been growing their commercial deposits but as shown in the next few exhibits, deposit growth while strong has lagged loan growth. Given that much of that loan growth has been into the sponsor world where lending terms have likely been competitive and funded by commercial deposit growth, along with the fact that they have the lowest interest-bearing deposit beta and the 2nd lowest cost of IB deposits, their guidance of additional sequential NIM compression makes sense. On the flip side, their capital markets update at Bernstein was a positive one and the stock has responded accordingly. From here, given their existing NII guide and the mix shift that’s happening, we would tend to think that dynamic (NIM headwind) should continue.
      • TFC (Sector Underperform) – was vocal at the Bernstein Conference regarding the NIM headwinds they are facing. We think a similar analogy to WFC holds with TFC as well. Like WFC, they have grown loans faster than deposits. Incremental deposit growth from here is more expensive than they would like given their commentary about wanting more non-IB deposits. They are also up against the headwind of forward starting swaps in 2H’26 which makes the path more difficult.
      • CFG (Sector Perform) – An interesting example of a number of nuances. Deposit growth over the cycle has exceeded loan growth thanks to rotating the loan book away from legacy Auto & Education loans to Home Equity & Private Bank loans. At the same time the Private Bank is bringing with it ~30-33% non-IB deposits relative to a base of ~22.5% with those Private Bank deposits on track to be $18bil-$20bil by year end. Combine the positive mix shifting that’s happening along with the tailwind from the swap abatement and we find ourselves above consensus for FY’26 & FY’27 NII. At Bernstein, management continued to endorse the Q and full year guide. While they did acknowledge that there had been a bit more deposit competition, their forecast did at least in part already take that into account.

To wrap up, last week provided some breadcrumbs on how to think about the space in this interim rate period. We continue to be positive on Regions Financial (high % NIB, CD reprice, fixed asset reprice) along with Fifth Third and US Bancorp while having underperforms on M&T, Truist & Wells Fargo. While we expect the deposit debate to continue, the sector as a whole has likely been a victim of broader rotation suggesting that perhaps the recent sentiment has been a bit overdone. We continue to remain constructive on the regional banks.
Source: S&P Global
Source: S&P Global
Source: S&P Global


Current Rating Distribution

Coverage Universe Percent
Sector Outperform 31.25
Sector Perform 50
Sector Underperform 18.75

DISCLOSURES AND DISCLAIMERS

Analyst Certification

The analyst, 22V Research Group, primarily responsible for the preparation of this research report attests to the following: (1) that the views and opinions rendered in this research report reflect his or her personal views about the subject companies or issuers; and (2) that no part of the research analyst’s compensation was, is, or will be directly related to the specific recommendations or views in this research report.

Analyst Certifications and Independence of Research.

Each of the 22V Research analysts whose names appear on the front page of this report hereby certify that all the views expressed in this Report accurately reflect our personal views about any and all of the subject securities or issuers and that no part of our compensation was, is, or will be, directly or indirectly, related to the specific recommendations or views of in this Report.

22V Research (the “Company”) is an independent research provider. The Company is not a member of the FINRA or the SIPC and is not a registered broker dealer or investment adviser. 22V Research has no other regulated or unregulated business activities which conflict with its provision of independent research.

22V Research, LLC is a professional services and independent publication organization. 22V Research, LLC is not a securities broker-dealer, not a member of the Financial Industry Regulatory Authority (FINRA), not a registered investment advisor (RIA) and not a member of SIPC.

Securities transactions, when offered, are offered by 22V Securities, LLC through LPS Capital, LLC. Certain employees of 22V Securities, LLC are dually registered as securities representatives of LPS Capital, LLC or Analyst Hub Securities, LLC. 22V Securities, LPS Capital and Analyst Hub Securities are members FINRA, SIPC.

https://brokercheck.finra.org/

Current Ratings Definition.

SECTOR OUTPERFORM: An “outperform” rating anticipates the company will outperform the S&P Regional Banking Index (peer group).

SECTOR PERFORM: A “market perform” rating anticipates the company will perform in line with the S&P Regional Banking Index (peer group).

SECTOR UNDERPERFORM: An “underperform” rating anticipates the company will underperform the S&P Regional Banking Index (peer group).

Limitation Of Research And Information.

This Report has been prepared for distribution to only qualified institutional or professional clients of 22V Research Group. The contents of this Report represent the views, opinions, and analyses of its authors. The information contained herein does not constitute financial, legal, tax or any other advice. All third-party data presented herein were obtained from publicly available sources which are believed to be reliable; however, the Company makes no warranty, express or implied, concerning the accuracy or completeness of such information. In no event shall the Company be responsible or liable for the correctness of, or update to, any such material or for any damage or lost opportunities resulting from use of this data. Nothing contained in this Report or any distribution by the Company should be construed as any offer to sell, or any solicitation of an offer to buy, any security or investment. Any research or other material received should not be construed as individualized investment advice. Investment decisions should be made as part of an overall portfolio strategy and you should consult with a professional financial advisor, legal and tax advisor prior to making any investment decision. 22V Research Group shall not be liable for any direct or indirect, incidental or consequential loss or damage (including loss of profits, revenue or goodwill) arising from any investment decisions based on information or research obtained from 22V Research Group.

Reproduction And Distribution Strictly Prohibited.

No user of this Report may reproduce, modify, copy, distribute, sell, resell, transmit, transfer, license, assign or publish the Report itself or any information contained therein. Notwithstanding the foregoing, clients with access to working models are permitted to alter or modify the information contained therein, provided that it is solely for such client’s own use. This Report is not intended to be available or distributed for any purpose that would be deemed unlawful or otherwise prohibited by any local, state, national or international laws or regulations or would otherwise subject the Company to registration or regulation of any kind within such jurisdiction.

Copyrights, Trademarks, Intellectual Property.

22V Research Group, and any logos or marks included in this Report are proprietary materials. The use of such terms and logos and marks without the express written consent of 22V Research Group is strictly prohibited. The copyright in the pages or in the screens of the Report, and in the information and material therein, is proprietary material owned by 22V Research Group unless otherwise indicated. The unauthorized use of any material on this Report may violate numerous statutes, regulations and laws, including, but not limited to, copyright, trademark, trade secret or patent laws.