

Companies began quantifying the early impacts of AI on margins in 1Q earnings. It is early – only 12 companies provided numbers – but the market is extrapolating margin improvements from AI, so it is important to track these initial estimates and what they imply for S&P 500 fair value.
First… companies who quantified the impact from their AI tools have much higher earnings sentiment than the rest of the index. Companies that mentioned use cases of AI, but did not quantify the impact, also have higher margin sentiment than the index. They haven’t diverged from the index, for which sentiment is moving lower, but the spread is what is relevant here. The exercise of extrapolating numbers is helpful, but direction matters more in these early estimates, and the direction is towards margin improvement.
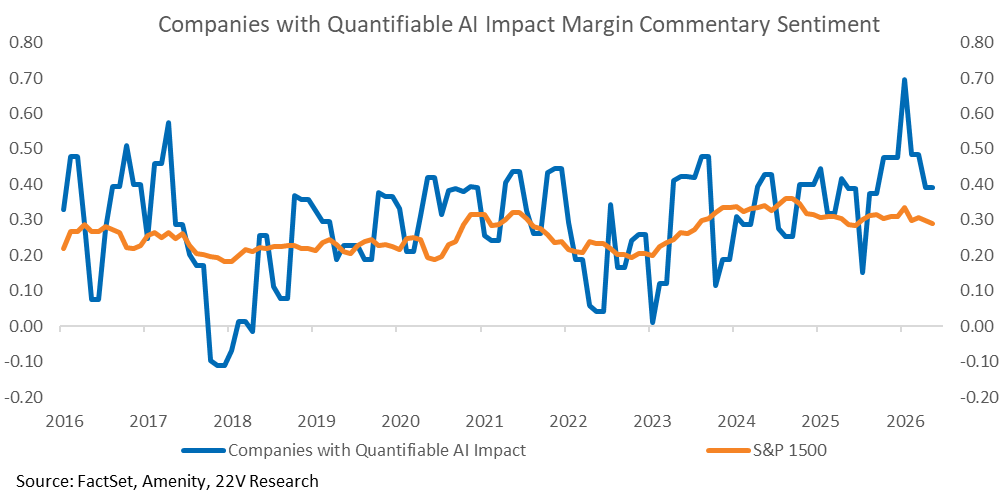
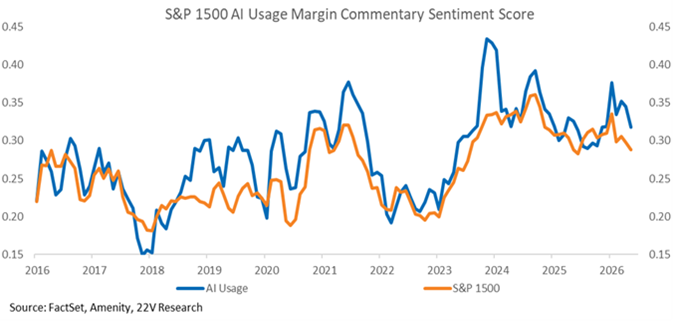
In this report, we lay out our fair value framework for AI-driven margin expansion to help provide anchors for upside scenarios, and detail our process for tracking the quantifiable impact on margins and what that implies for fair value. Net net, extrapolating the early quantifiers implies Fair Value +5%, at minimum, with likelier scenarios ranging from +10% to as high as +50%. Details below.
We use an LLM to filter earnings transcripts for comments detailing the numerical improvement in operations from AI. (We aren’t fundamental analysts, so we won’t opine on whether management is being truthful or not. We run the analysis assuming they are.) In aggregate, the early quantifiers have guided to 80bps of margin improvement, annually. Some examples of the comments…
CFG (Citizens Financial): “We expect to exit 2026 with an annualized run-rate benefit of approximately $100 million pre-tax from our AI initiatives.”
IBM: “We’ve delivered $4.5 billion of cumulative productivity savings since 2023 from AI-enabled transformation, and expect an additional $1 billion in 2026.”
NOW (ServiceNow): “Through Now-on-Now we’ve captured roughly $500 million of productivity internally since 2024, allowing us to exit the year into a new year with the same headcount while growing at Rule of 56.”
There are two caveats to our process: 1) Some of the quantifiers attribute margin improvements to AI and general business improvements, but we attribute it to AI to build the optimistic case. As more companies quantify AI, we will be able to refine this process. 2) The early quantifiers have higher SG&A/revenue (high payrolls) and lower PP&E/revenue (asset-light) than the index. It’s possible that those kinds of companies will implement AI successfully, but improvements can’t be extrapolated to the broader index. We do not know, but the focus should be on the upside given how positive companies sound about AI tools and margins.
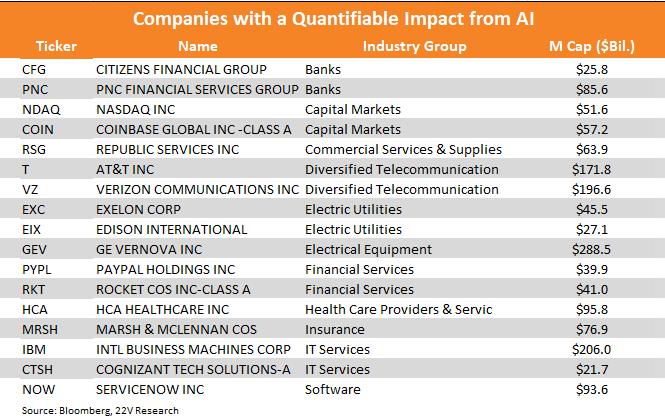
The quantifiers are tabulated here…
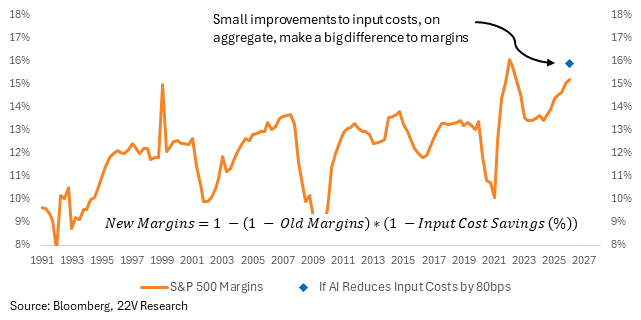
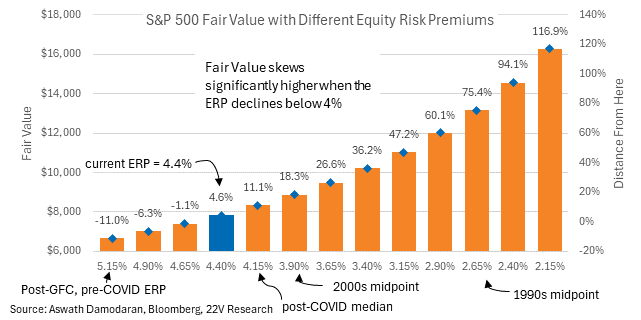
AI SAVES 80bps: There are two direct ways that cost savings increase fair value – a higher path of earnings and a higher long-term cash return ratio (because cash return is a function of ROE). Together, that’s worth +400 points (+5%). The equity risk premium would also move lower (fair value higher), an indirect result but one we have high conviction in. The equity risk premium is more difficult to model, so we provide a range of estimates; the magnitude of the impact would be another +~10% to as high as another +~50%.
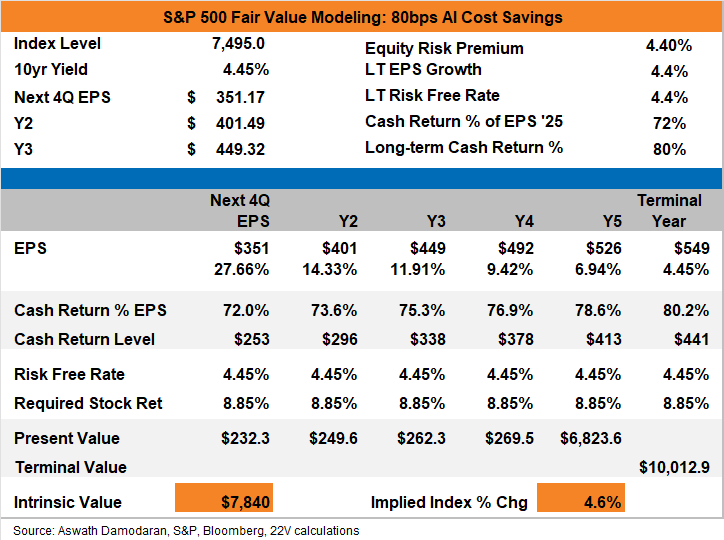
First, quantifying eps and cash return. If input costs for the S&P 500 fall 80bps, then margins would increase from 15.2% to 15.9%, nearing an all-time high.
Applying the 1% cost savings across the next three years of consensus estimates improves the EPS path from…
2026: $338 to $351
2027: $386 to $402
2028: $434 to $449
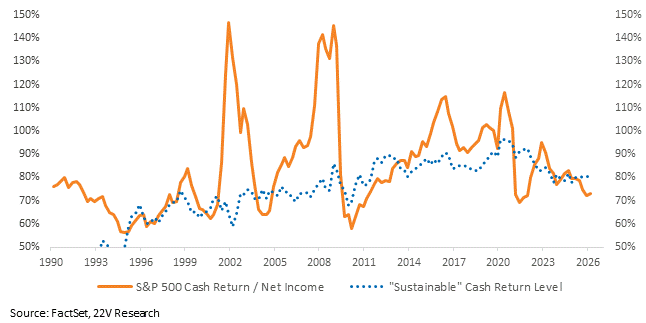
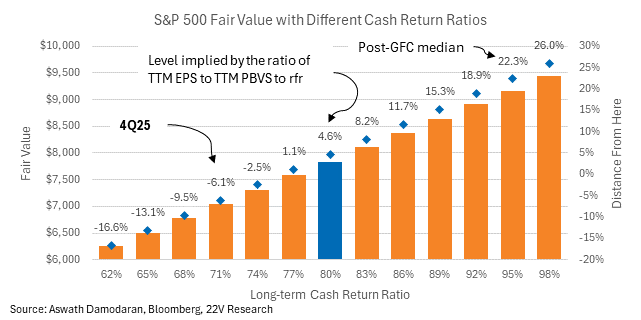
The cash return ratio would increase from 79% to 80%. We will stick to that number in our fair value model, but we have high conviction that cash return would increase above what is modeled. It has frequently tracked above the modeled “sustainable” level (chart below) in the past, and it seems a safe bet that fresh all-time high margins would lead to a cash return higher than its 55th percentile. We include a bar chart of Fair Value using different cash return ratios to offer different anchor points.
The full calculation for the 80bp cost savings simulation is below.
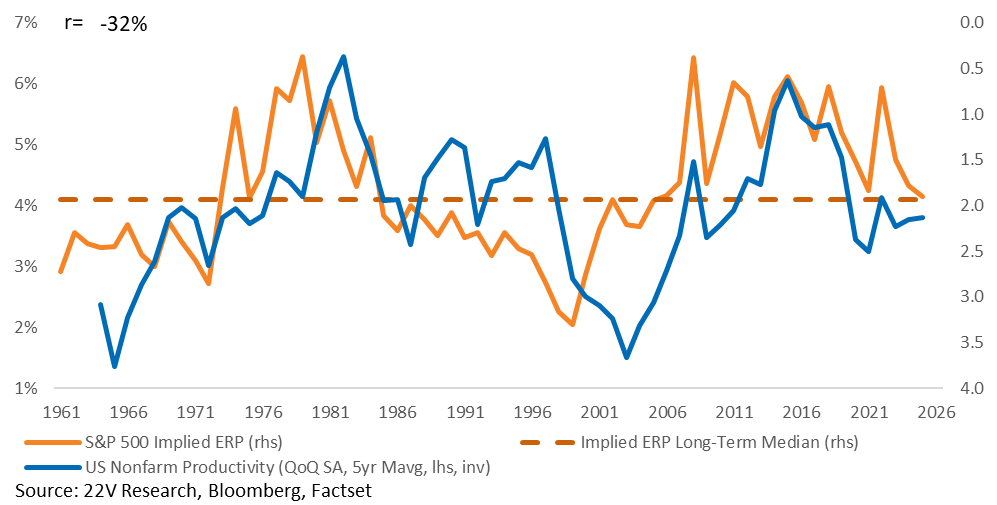
We do not adjust the ERP in the table above, but it is almost certainly going to decline. The ERP has moved in ranges based on productivity in the past. Better productivity = higher valuations. It is possible that the ERP would fall to a range more consistent with the 1990s or 2000s, a period of high productivity growth. That opens up additional upside in a range of +~10% to as high as +50%. Estimating an ERP based on productivity would be false precision – the practical implication is higher fair value, with a tail to much higher fair value.
FAIR VALUE EXPLAINER: We value the index using a DCF model, discounting aggregated dividends and buybacks. It is based on the work of valuation guru Aswath Damodaran. He has a great resource on his implied equity risk premium HERE.

