

Main Point: I was on my way to Tuckerman’s Ravine (to see if I might ski the lower part of it next year) when the April employment data were released. And it is now a bit late for an analysis of the beat vs miss. But there are a couple implications of the employment data recently that seem worth taking on board. First, there is tentative evidence that the breakeven employment growth rate might be slightly above zero. And second, outgoing Fed Chair Powell does seem right that the inflation trouble, ex-tariffs, does not obviously originate in the labor market. The caveat is that the standard model, which influences the role of the labor market is incomplete, so we must continue to monitor what the goods and services inflation data actually show. We get the April CPI tomorrow.
The main news from the employment report was that private employment beat the consensus again, reinforcing the perception that labor demand bottomed a while ago and that a labor demand “landslide” is increasingly unlikely. But the report highlighted a minor conundrum related to the so-called breakeven employment growth rate. The unemployment rate has been effectively unchanged during the past 3 and 8 months, as it turns out. But during these periods, total employment growth has run at 40 and 25 basis points respectively, (weakly) suggesting a breakeven employment growth rate in that range.
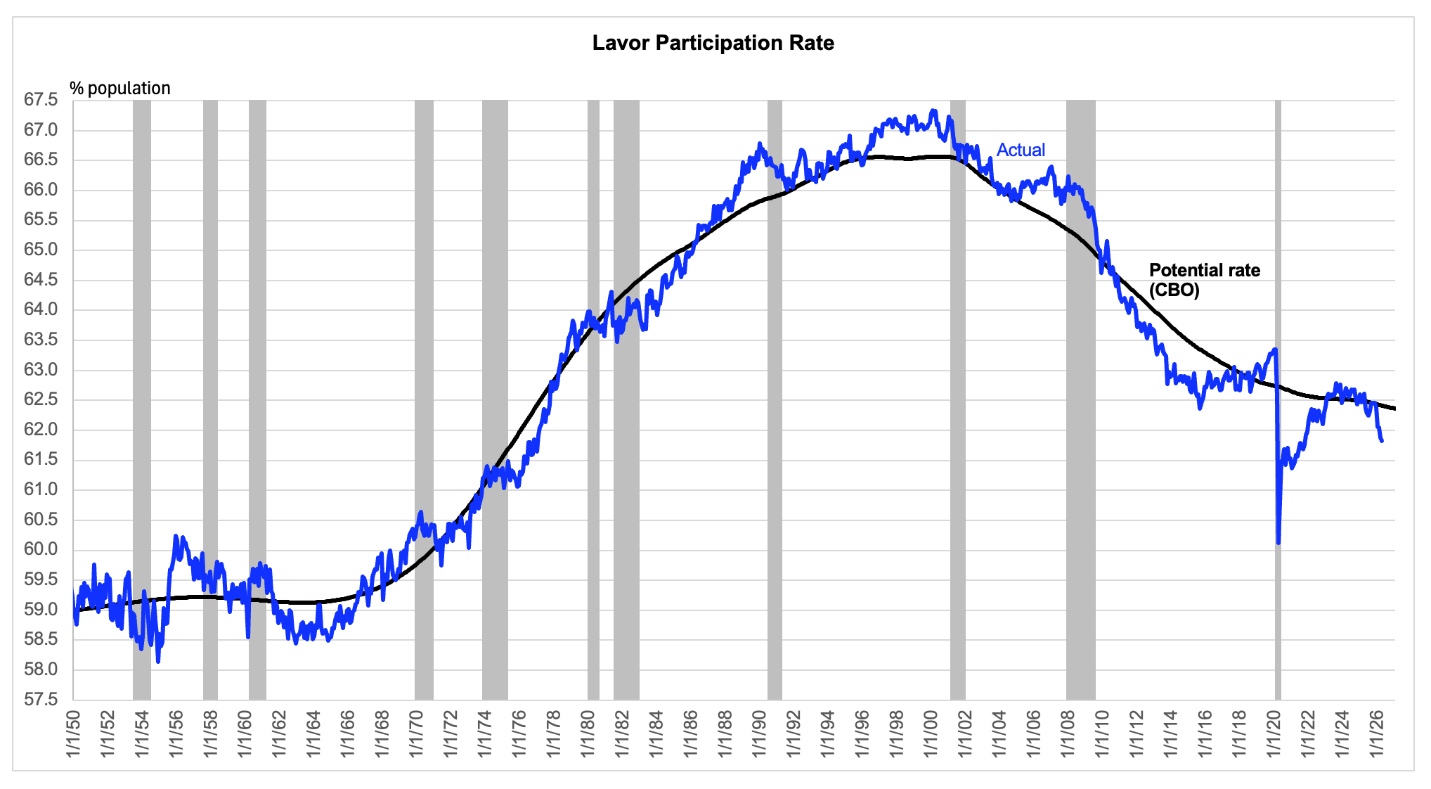
The tension here would be much more striking were it not for the steep decline of the labor force participation in recent months. The breakeven analysis formally looks through this in the sense that it assumes that changes of the participation rate are structural and not an indication of ebbing and flowing labor market slack. But if we were to assume, deviating slightly from the conventional arithmetic, that short run swings of the participation rate were not structural, then we would back into a recent breakeven employment growth rate of 2%! I will discuss below why we ought not go with that calculation, but also why we cannot ignore it entirely.
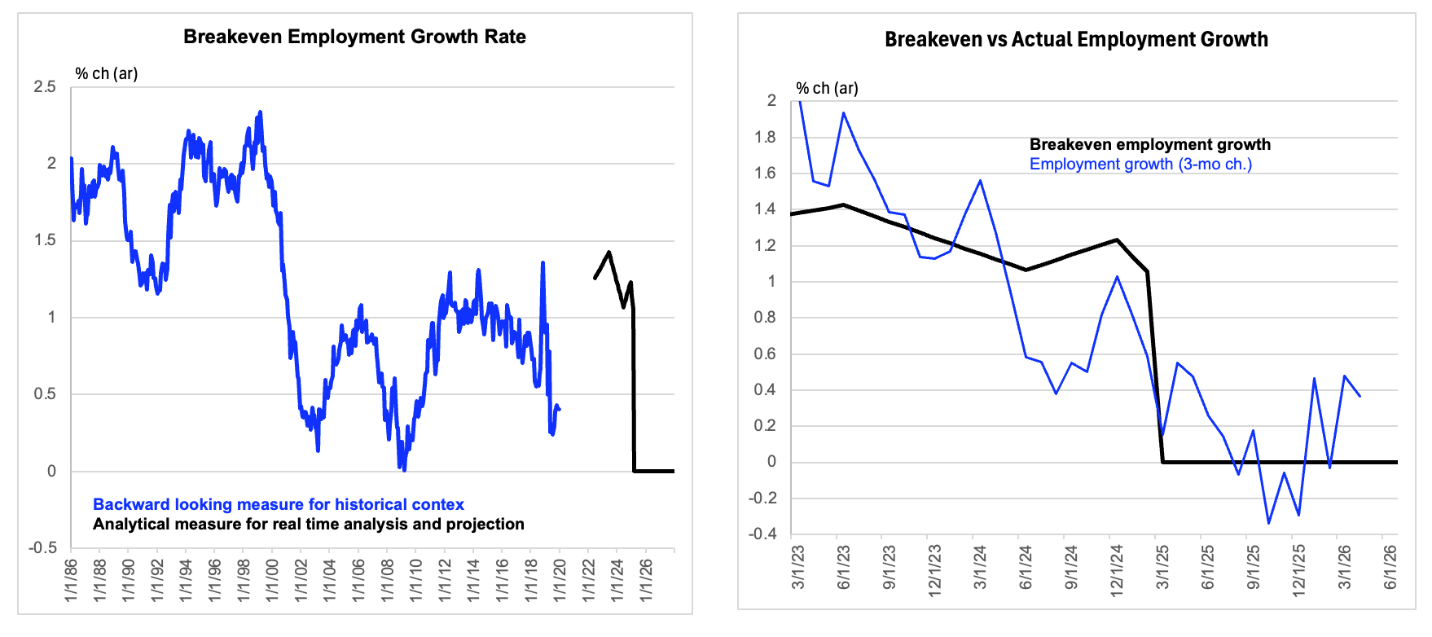
Measured employment growth running slightly above estimated breakeven
Labor market data are actual to April.
The chart above provides a summary of what is going on with the breakeven, as conventionally understood. Let’s consider the left panel first. The blue line backs into the breakeven employment growth rate via a backward-looking approach analogous to what I use immediately above. I will take some liberty in my description here in the interest of brevity, because I do not want to get into an extended tangent on changes of the participation rate relative to its estimated potential rate. But the line depicts the breakeven implicitly as the sum of the change of the unemployment rate and employment growth as measured in the household survey. The windows over which the changes are is measured is far wider than just three months, because such a narrow window would generate just measurement noise. As you can see, even my highly smoothed approach, using 36-month growth rates, leaves some noise in place. But I show the series to provide a rough historical context.
The analytical measure is much more important and is based on demographics, specifically immigration trends, native population dynamics, and labor force participation rates across various demographic cohorts. It came to prominence because of the work of Wendy Edelberg, which seems to have been replicated and effectively adopted at the Federal Reserve Board. And it has two major advantages over the backward-looking kludge, which I and others work up for context or as a cross check. First, and most obviously it is forward looking. Second, its signal is much less noisy because it is based on demographic trends.
As you can see from the right panel of the chart above, total employment growth has bottomed, and the 3-month rate has been running 40 bps above the estimated breakeven of zero. Given how noisily all these figures are estimated, I would make nothing of this recent gap between the analytical and empirical (or backward looking) measure of the breakeven. There is no tension there. There is a tension, however, if we – depart from the conventional approach and – view the recent trend in the labor force participation rate as cyclical and evidence that the labor market eased by more than the unemployment rate suggests.
There are two reasons not to do that. First, inferring the breakeven over 3-month window is simply unwise. Second, all the decline in the participation rate, as in the employment population ratio, has been concentrated outside prime-age workers, of 25-54 years. On the other hand, we ought not just dismiss the collapsing employment / population ratio even if it is concentrated outside prime age. It reinforces the very tentative point from the more conventional analysis that the breakeven is more likely above than below zero, so I will tilt slightly upward. I cannot go far because these empirical or backward looking measures are so noisy. But perhaps I could be convinced that the breakeven employment growth rate is 0.2%?
Reasonable people will disagree on how to incorporate this
Is it a signal of slack developing?
Labor market data are actual to April.
Standard model, FWIW
With a little less handwaving, I will move on to my second point, which is that the recent labor market data seem to reinforce outgoing Fed Chair Powell’s claim that the ex-tariff inflation pressures do not obviously originate in the labor market. Or another way to put this is that the standard model, the so-called New Keynesian Phillips Curve, does not suggest that we have good grounds for extrapolating this inflation overshoot. There is a decent logic to Powell’s claim that once the tariff impetus passes through, underlying inflation should renormalize. The trouble relates to relying on what inflation should be doing, as I will get to below.
The standard model says that inflation is not just a function of the labor market. Inflation is affected also by inflation expectations among relevant actors in the real economy. And there are some formulations that also drag in productivity growth, just not in the way incoming Chair Warsh assumes. A temporary productivity pulse is meant to provide a direct impetus to inflation, although Warsh may not be aware of this because he relies on his heightened intuition which has served him so well in his big macro calls over the decades.
But, as the retention of the term “Phillips Curve” suggests, the state of the labor market plays a central role in the standard model. Indeed, my very amateur reading of the history of the NK Phillips Curve is that it was developed to rescue – from the rational expectations revolution – the old idea that monetary policy has real effects in the short run. Specifically, excessive demand (which may reflect monetary policy) creates upward pressure on inflation. However, firms raise prices with a lag, so the immediate effect of this is an overshoot of labor demand and a tightening of the labor market which is fundamentally a reflection of an intention to raise prices. One fun and perhaps underappreciated aspect of this story is that it is actually the intention to raise prices, rather than say upward pressure on wages, that does the work here. And this relates directly to why relying on productivity surprise might not be a wise way to manage inflation. But that is well above my paygrade and beyond the context of this note.[1]
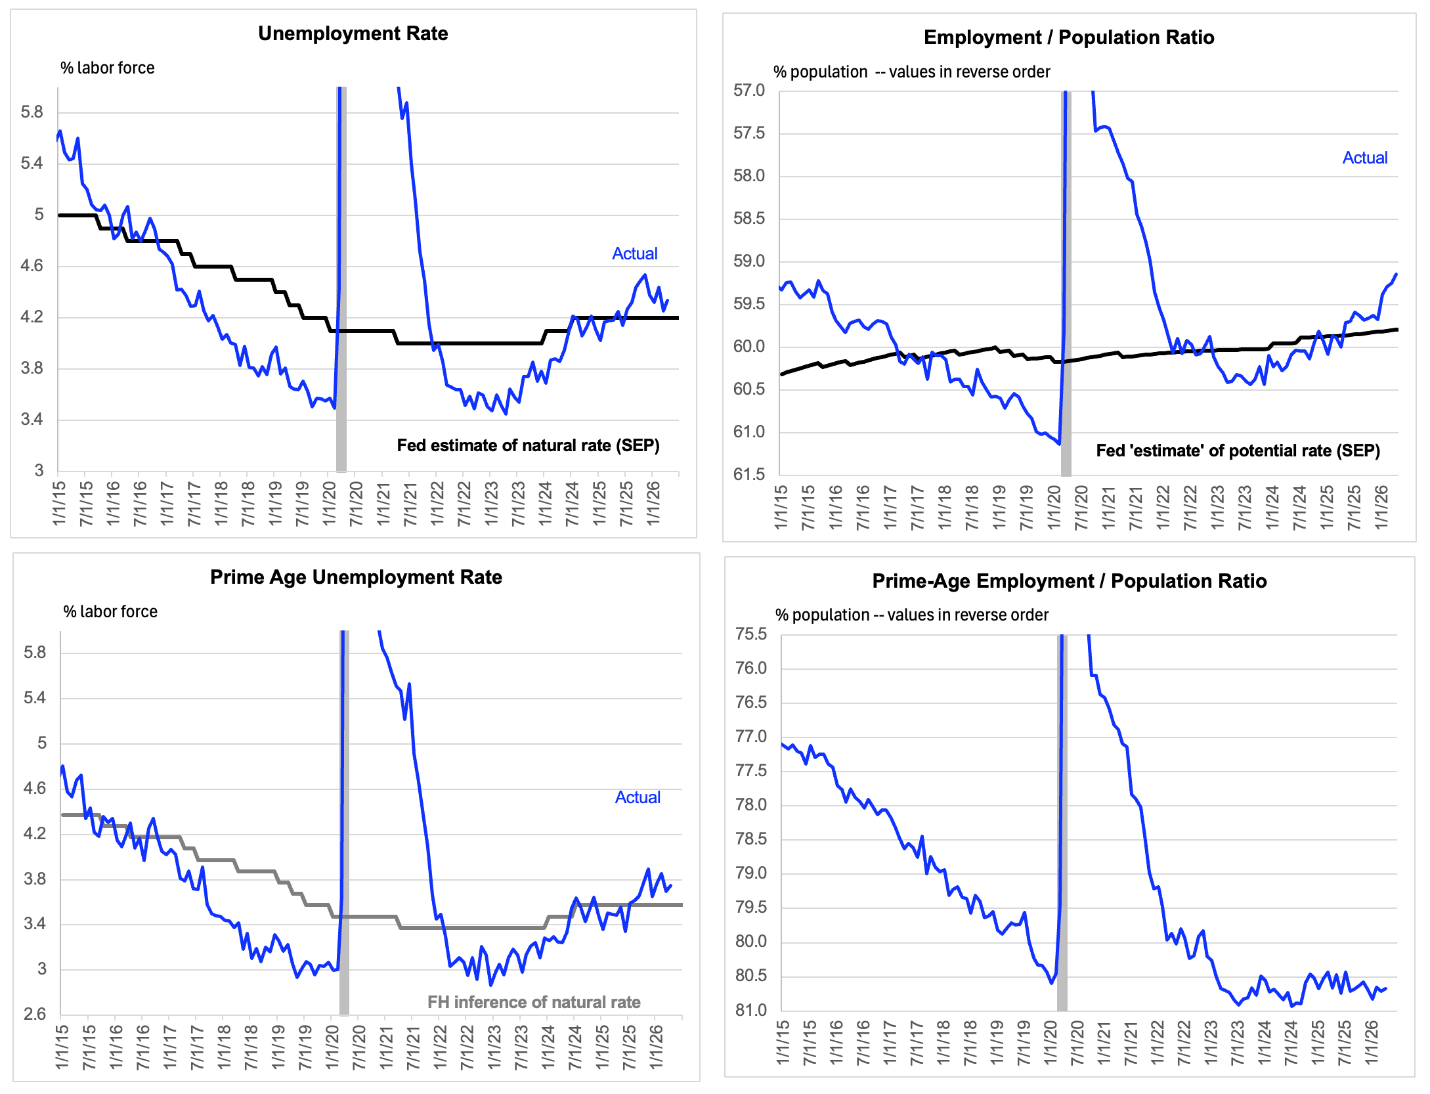
Instead, let’s just take a look at some evidence related to the main driver of inflation within the standard model, which is the state of the labor market, that is the level of employment relative to normal. The left panel of the chart below shows that the unemployment rate is actually slightly above the natural rate, as estimated by members of the FOMC (and ratified by estimates at the CBO). The employment / population ratio is a broader measure of labor market slack and takes on board deviations of the actual participation rate from estimates of its own potential rate. It suggests a bit more slack than the unemployment rate does. And – as alluded to above – it suggests that this slack has recently been increasing rapidly. (In the chart, values there are shown in reverse order to facilitate comparison with unemployment.)
On balance, evidence does not suggest overheating
Labor market data are actual to April.
There is a case for confining our analysis here to prime age workers, in part because they are the most productive and have the least volatile behavior. The prime age unemployment rate has been trending slightly higher in recent years and has recent arguably stabilized at a level that is slightly above what I breezily assume might be the natural rate for this specific group implied by the Fed’s estimate of the natural rate within the entire labor market. (I chop off 62.5 bps, so the two measures are in line for recent periods of apparent equilibrium.) The prime-age employment / population ratio has been stable and at a level that might even seem to imply that the labor market is a bit tight. But it is the outlier in this work, and it would be dispositive only if we dismissed non-prime age workers and the tendency of the prime age participation rate to rise in recent years. Powell seems right when he says that the labor market is not tight. And he might also be right when he suggests it has had a very slight tendency to ease in recent years.
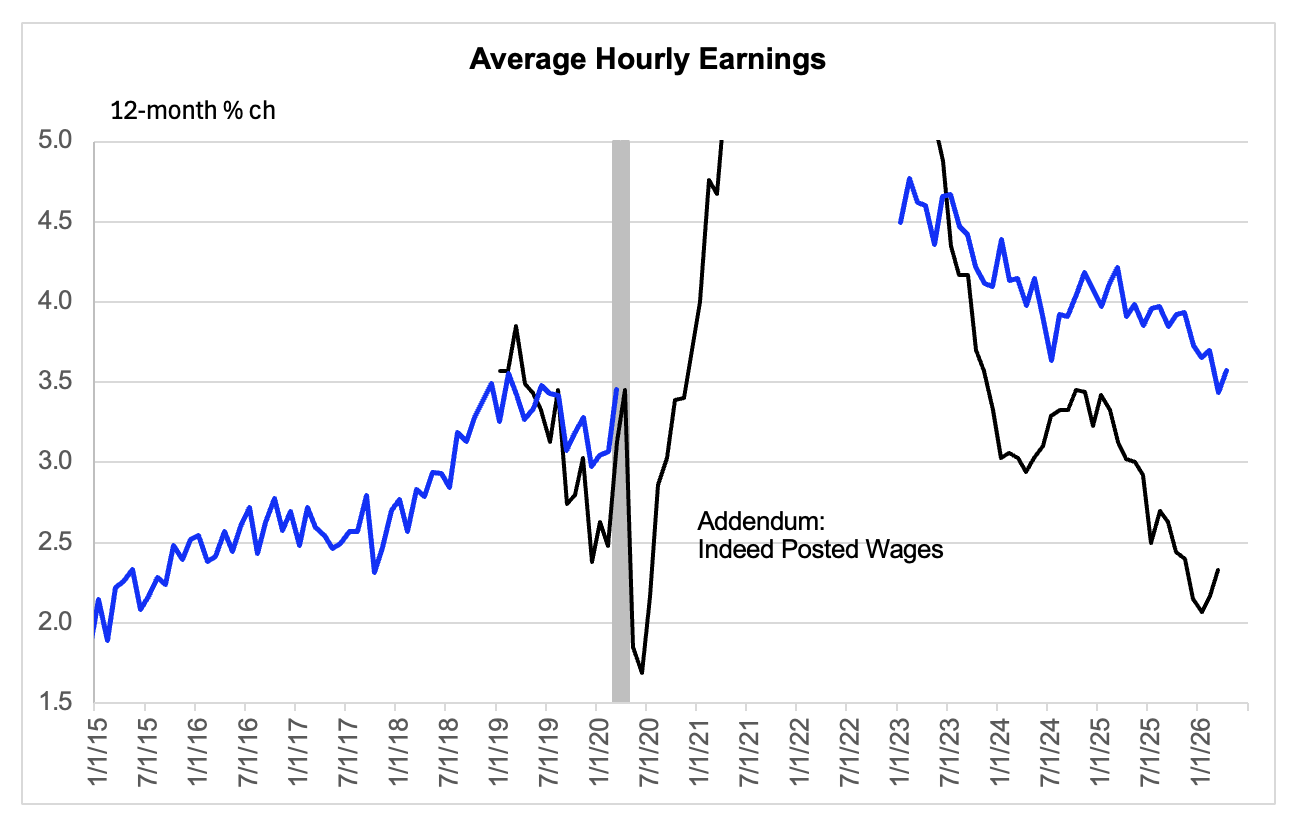
As I mentioned above, the standard model does not really allow us to use wages as a reliable cross check on whether the labor market is tight or not. The unemployment rate, rather than wage growth, fits into empirical models of the Phillips Curve for good reason. There are scenarios, consistent with the model, in which wage growth slows, even as inflation pressures build. But if the structure of the economy is not changing rapidly, as is usually a sensible base case, then wages can be relevant. And their behavior is not inconsistent with the view that the labor market has not overshot into overheating. The upturn in posted wage growth is interesting, but it comes from a very low level at a time when expected productivity growth may have risen.
A reasonable criticism of the foregoing might be that there seems to be a lot of mumbo jumbo and uncertainty involved in applying the standard model. I think that is true. My own view is that the Phillips Curve may or may not exist and that its main value, if it has any, is to provide a rationalization of the view that monetary policy has real effects. Separate from that, the idea that a major inflation pulse will be reflected in an observable labor market overshoot is probably more helpful than unhelpful. On the other hand, we cannot rely exclusively on an at-best incomplete model, especially when it is not generating a strong signal either way. And that is why I prefer to pay very close attention to what various slices of the PCE Price Index are actually showing than to lean heavily on priors, anchored in some specific riff on the standard model. Let’s see what tomorrow’s CPI brings and – specifically – how it moves the informed consensus for the April Core PCE Price Index.
In the meantime, and probably beyond 8:30 as well, underlying inflation is now high enough that the Fed will want to guide aggregate demand growth lower, as I have been emphasizing. If the breakeven employment growth rate is 20 bps higher than I had assumed, then that affects the quantification slightly, but it would not seem to be the main thing.
Moderate wage growth is not dispositive but arguably consistent
with idea labor market is not overheating
Indeed posted wage data are actual March. Average hourly earnings figures are actual to April
[1] My reading of the standard model is that a labor market overshoot in response to excessive demand that was followed by a surprise spurt in productivity would more likely result in wider profit margins than an avoidance of inflation. I expect my betters in academia will get into this if Warsh continues to press his current line.

