

Now that the Fed is out of the way, we can stop focusing on that catalyst and take a longer-term view on how things may play out. Doing so here inclines me toward a short view in nearby rates and to wondering if the dollar might stabilize for a bit. The primary trend in the dollar seemingly remains downward, but if rates back up it might bounce briefly.
Dovish but
Wednesday’s FOMC meeting brought news that was seemingly at least somewhat dovish. The 25 bp decline in the SEP median rate expectation for the end of 2025 was a surprise, strictly speaking. But it was probably not very incremental, because a large minority were looking for the result, while the wrong-footed majority had probably viewed the question as a near call. More importantly, though, the Press Release was adamant that the balance of risks had shifted toward labor market weakness and away from inflation.
During the Press Conference, Chair Powell was clear that the shift reflected movement on both sides. Not only had the risk of a downturn in the labor market intensified, but the risk of an intolerable rise of inflation had declined, according to Powell. Powell also retreated to his characterization of monetary policy as restrictive, having recently flirted with the idea it was only slightly restrictive. That is interesting timing, as I will get to below.[1]
One might argue that the Fed did not ratify the rates path embedded in the futures strip. And one would be right about that factually, as Powell explicitly stated that he was not “blessing” market pricing, while emphasizing that the rates path is unknown. But that does not really make for a hawkish surprise, as the consensus had not factored in that Powell would offer such dispensation. On Fed day, the beat or miss is not usually relative to market pricing, but relative to what people expected the Fed to say. And what they said was to the dovish side. That seems clear.
There was a nice run here, but it did not extend after Wednesday
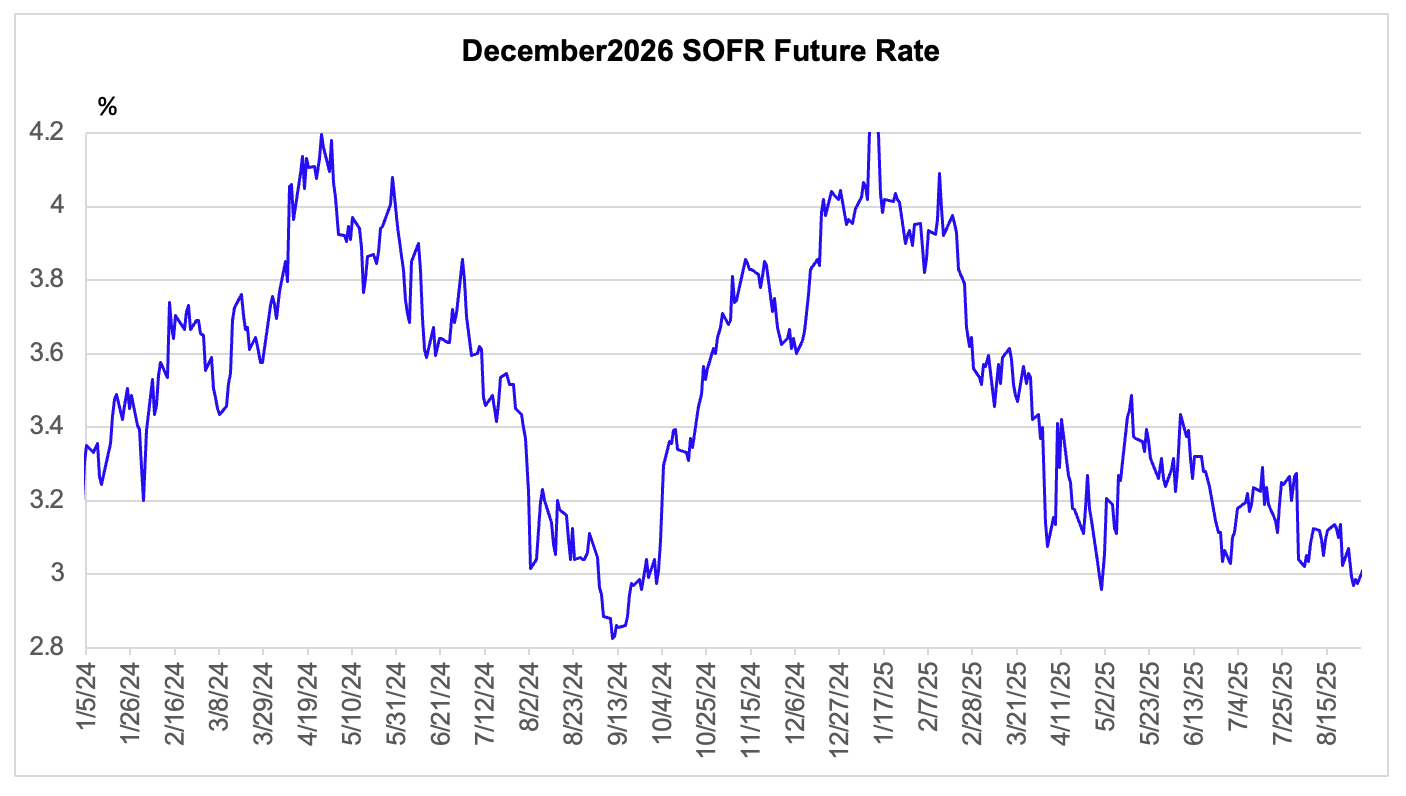
Pricing is to the Friday close. I follow the Dec 2026 rate because that currently prices roughly the “terminal” rate. The expected absolute low might be slightly lower, simply because the data of it is unknown and would therefore be smoothed over in the rates strip.
But the price action has been a bit more nuanced. Measured from the Tuesday close, equities have moved somewhat higher, and the coupon curve has steepened, as would be consistent with a dovish take. But the rates strip has backed up slightly, and the dollar has inched up. My daily version of the Fed’s Financial Conditions Index, which is a not unreasonable way to aggregate these moves, has changed very little since Tuesday, although there has been a dramatic easing in recent weeks.
There is no way to prove the point, but I suspect that the move in rates and therefore the dollar, small as it has been, is perhaps more about the Fed event getting out of the way and a possibly quite dovish catalyst passing, than it has been about the actual news. It might not be best practice to short the futures strip or go long the dollar the day before the Fed resumes rate cuts? I had set myself a reminder not to do that. But, again, who knows?
Market sees a prolonged period of the real rate at or below 1%
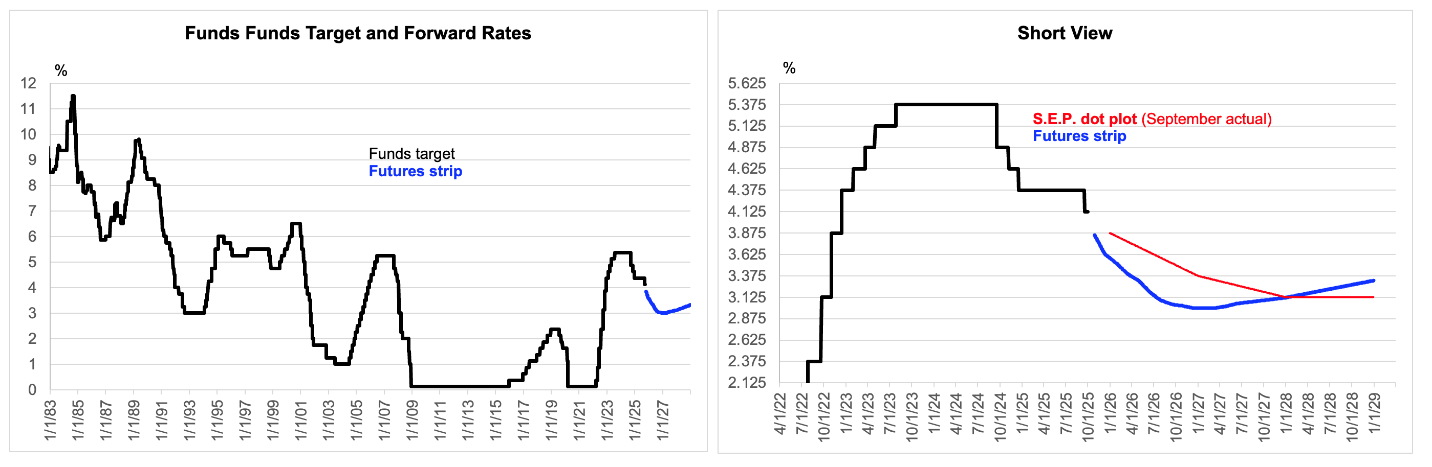
Futures strip is the Bloomberg WIRP function through the July 2026 meeting and then inferences from the SOFR curve beyond that. I make no adjustment for the minor credit spread there. The larger issue would be the upward sloping term premium.
Now that the event has passed, it is reasonable to look at the rates path and at financial conditions to develop our own view on how things look and to challenge Powell’s fallible interpretation if appropriate. The futures strip has the funds rate drifting below 3 1/8% during the next several months and then remaining there through the end of 2027. It then drifts somewhat higher, although it is hard to read that clearly because of the possible presence of an upward sloping term premium. Throughout, the implied real rate would seem to be 1% or lower.
This is not decisive evidence that the forward pricing of the Fed is aggressive. If the economy stumbles into recession, rates have plenty of room to rally. But from a risk-reward perspective, it looks somewhat more attractive to be short than long here, especially now that the Fed announcement (of resumed ease) is out of the way. Like the call itself, the timing here is not a slam dunk by any means. We must still, for example, get past the journalists who described the August CPI and PPI releases as hawkish shifting to its implication for this week’s PCE release as being dovish, without missing a beat! But timing is never obvious, and this is not a huge call anyway. Even if I am right, the data driven wiggles will probably be the more important.
Powell calls this restrictive — or oddly ignores it
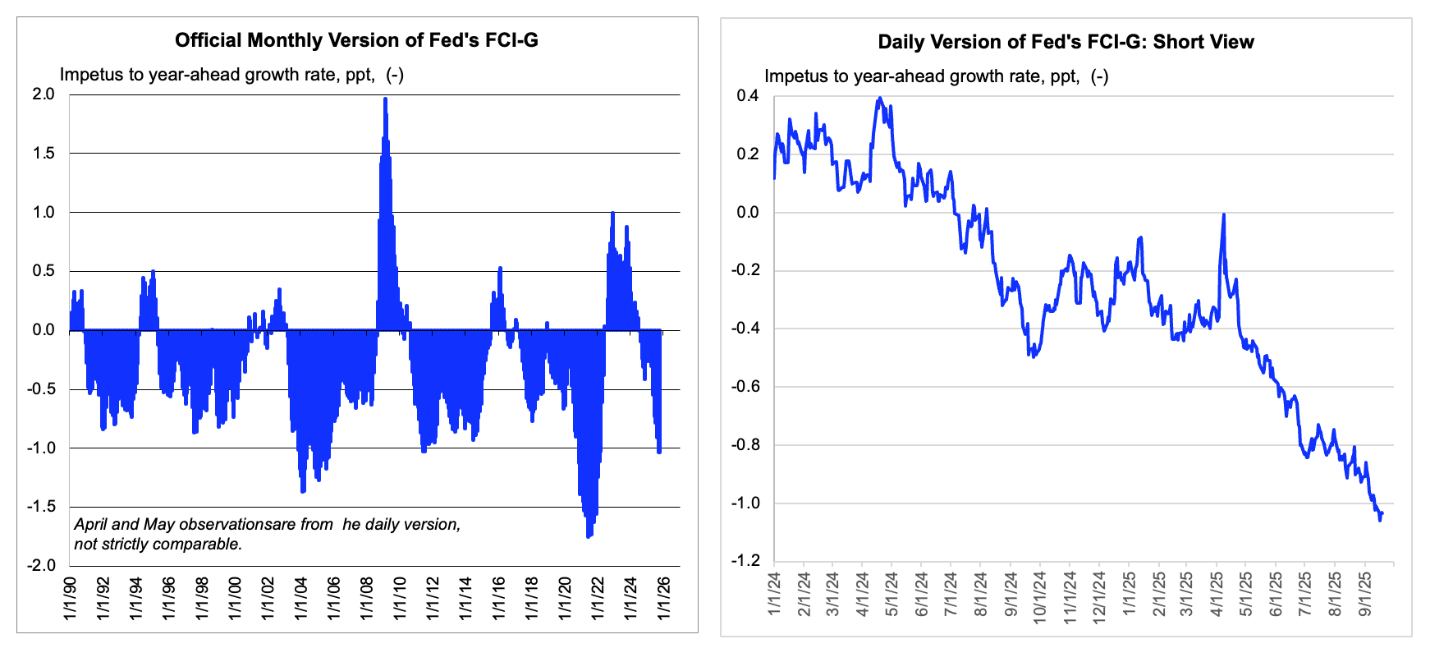
Daily version is actual to Friday close. Official monthly FCI-G is actual to July and updated to September with daily version.
One premise here is that I disagree with Powell’s characterization that monetary policy is tight. Not to imply that the Fed is beholden to the model, but my daily version of their own financial conditions index, FCI-G, shows a substantial easing since the beginning of the year, which has been broadly based. The measured easing has not just been about equity prices. And even if it were, that would not be a reason to fade its effect. The behavior of rich people in the economy certainly counts, and (if anything) the way FCI-G captures the equity impetus might be understated when the ratio of stock market capitalization to GDP is high. Maybe folks who want to exclude equities believe they will fall. That would be a reasonable take but also a separate discussion.[2]
Not just equities, and even if it were….
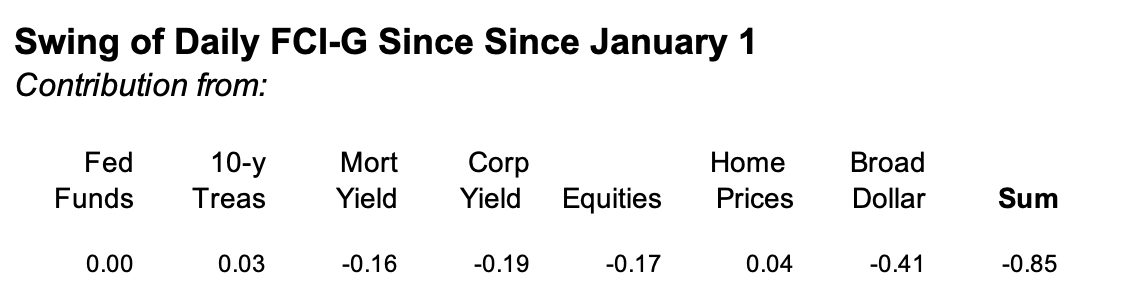
Data are actual to Friday close.
Anyhow, as of the Friday close, it looks like daily FCI-G mapped to an official FCI-G that would be close to the most stimulative level in the history of the indicator excluding the Covid shock period. In fairness, there is no direct mapping from the level of financial conditions to the prospective growth outlook. The Fed is meant to encourage ease or stimulus there to mitigate or accept headwinds or tailwinds developing in the real economy, depending in large part on the inflation outlook.
With the advantage of hindsight, we might say that the recent easing has helped offset the direct drag from the tariffs and has been “blessed” by the Fed because they have been willing to look past most of the inflation side of that same tariff issue. On the other hand, we have had a nice jolt to financial conditions recently, just as the peak effects from tariff uncertainty are arguably passing. And I stick to the view that the Fed will want growth at or more likely below potential to ensure that the inflation does indeed prove transitory.[3]
The labor market and demand-side reads differ slightly
Powell’s interpretation of the labor market is (newly) that it implies below potential growth and supports his take that policy is restrictive. I share his take on the labor market indicators, and I noticed he is working with a breakeven employment growth rate that is very close to the one I stole from Wendy Edelberg. But the spending side of the economy looks ok, as was highlighted by last week’s retail trade data. Real PCE growth is tracking at 2% for the third quarter, and the underlying trend there looks like it might be moving above the 1 1/4% growth rate that I had earlier eyeballed (see left panel of chart below). And capital spending outside structures remains surprisingly strong, as Powell highlighted on Wednesday.
With demand growth holding up, and with productivity growth looking solid and subject to upward revision, the case for a “landslide” in labor demand to resolve earlier hoarding does not look compelling. Powell is right that a slow growth of employment roughly matched to a low breakeven is more fragile than a similar near-equilibrium with stronger growth. But that highlights a risk rather than a central case.
Real PCE looks fine, especially relative to potential, and inflation remains slightly too high
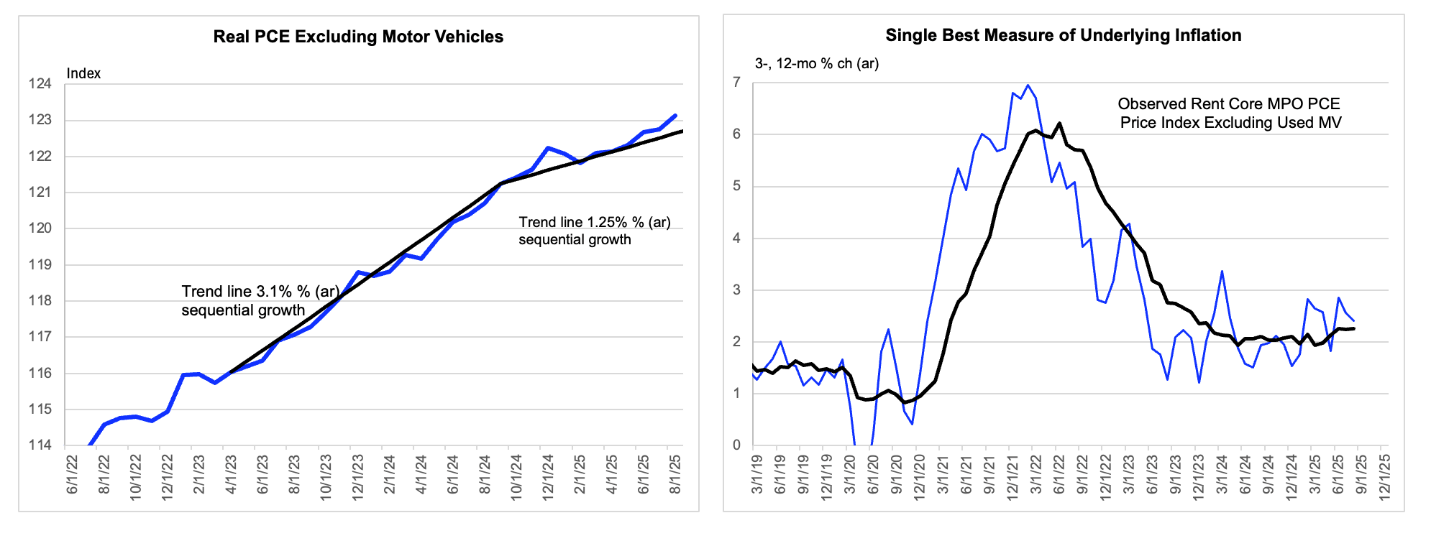
Data are actual to July and estimated for August.
Meanwhile, inflation remains somewhat elevated, despite the better news in July and August. My preferred measure looks slightly more benign than the standard Core PCE. But it has a (hopefully stable) downward bias and implies an underlying rate of about 2 ½%, with most of the tariff impetus still presumably in front of us – even in rate of change terms.
Augustinian take on dollar
I will conclude with a brief comment on the dollar. For a conventional macro analyst such as myself, currencies are hard to understand even in retrospect. But I have been arguing that the primary trend in the dollar is downward, mainly because the current level of the dollar in real trade weighted terms is likely to be consistent with a current account deficit that implies a steady rapid increase in America’s net external debt. Part of this has to do with the yield advantage supporting the dollar at its still high real value. That yield advantage is likely to be sustained only in an environment in which US demand growth is relatively strong, which would reinforce the negative effect of the dollar itself on the net exports deficit. Hence my choice of the term “consistent with” to reflect the role of the dollar as a direct cause and itself as a reflection of another force that is a direct cause. The issue here is not that America will go broke. And the external accounts should probably not be a focus of policy. But portfolio balance considerations imply downward pressure on the dollar over time.[4]
Give me chastity and continence but not yet
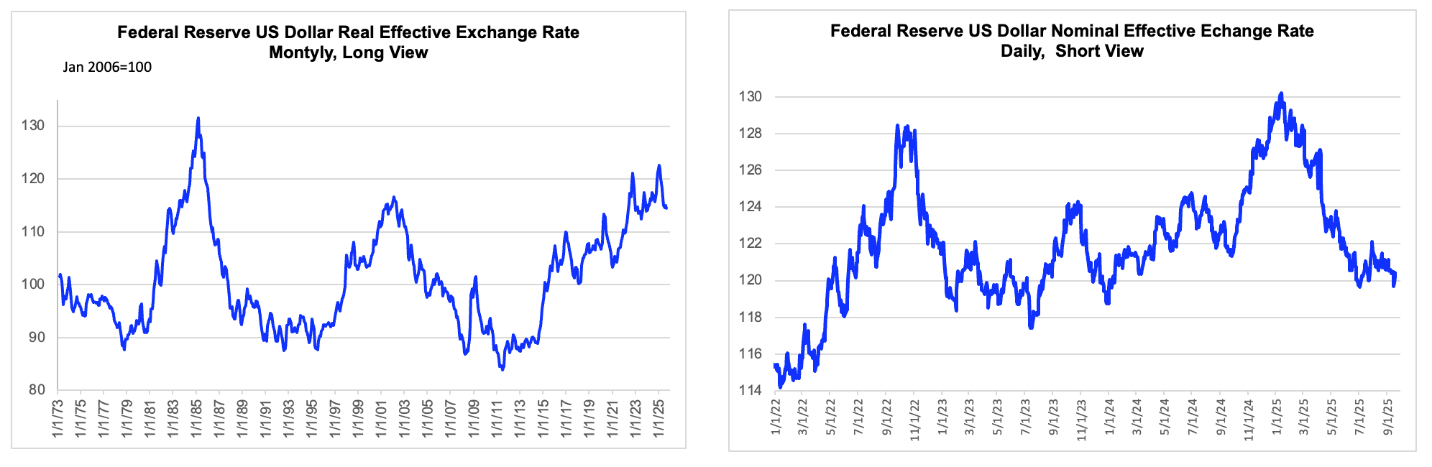
Nominal dollar is actual to a week ago and estimated to Friday based on all the nominal FX rates in the calculation. Real dollar is monthly and actual to July and estimated to the Friday close based on the nominal exchange rate. Thanks to my summer intern Holden Pecoraro for automating the dollar update, which was beyond this analyst’s computing skills.
With the primary trend seemingly downward, a long position in the dollar generally seems too cute for somebody with my limited toolkit. But the dollar story is now very well circulated, and the currency has been roughly flat for the past couple months, down 7 ½% from its cyclical peak. I am inclined to oscillate between short rates and short the dollar, I guess. On Tuesday, we will get some new data allowing us to update the slow-moving portfolio balance story. I would rather focus on the information there to add value where I can than to make the heroic call here. Such things are why you get the big bucks. There’s a very good reason currency folks read entrails, rather than mostly macro. 😀

