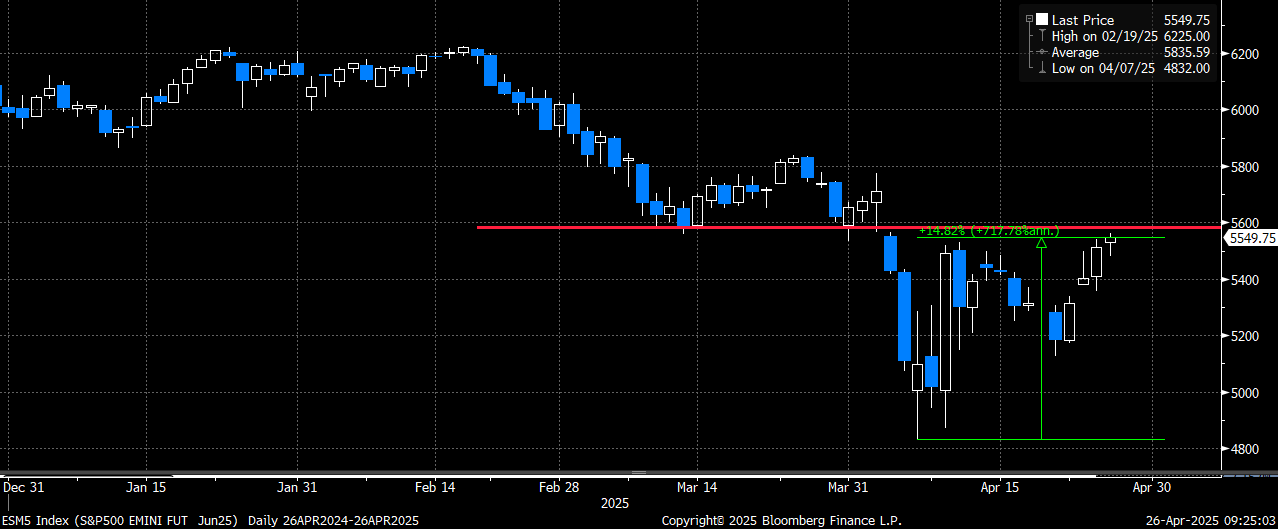
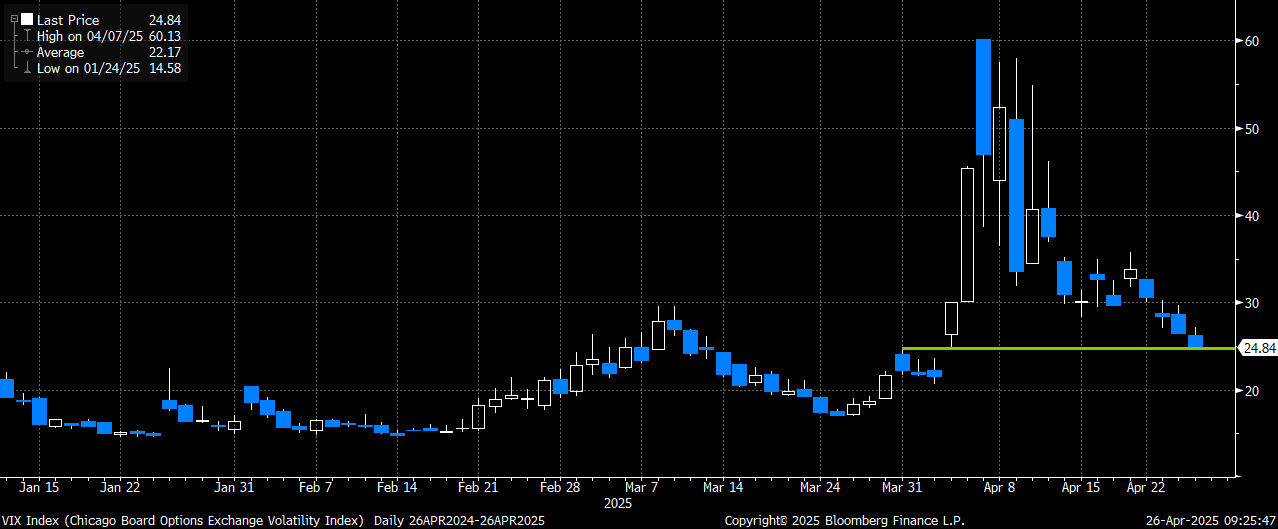
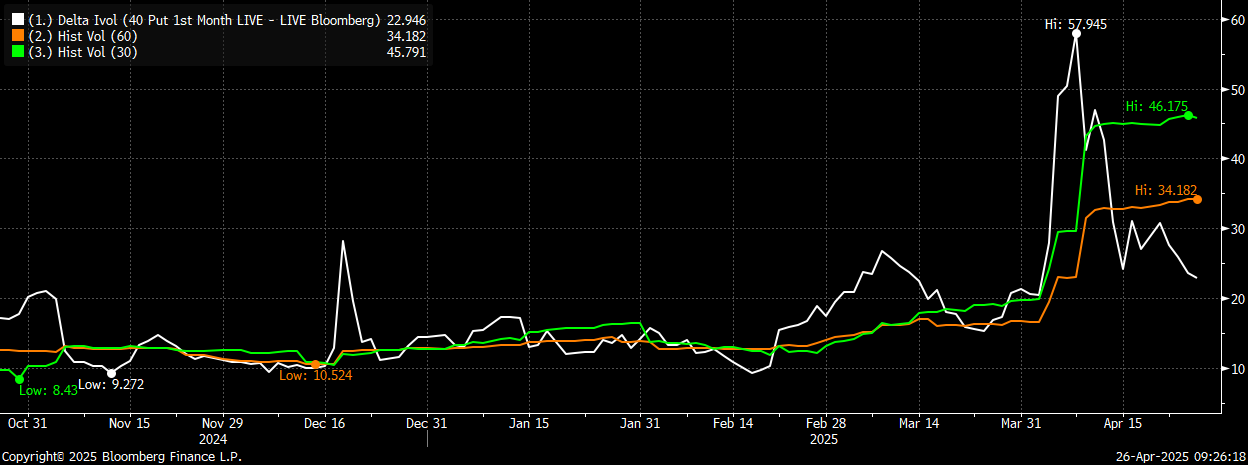
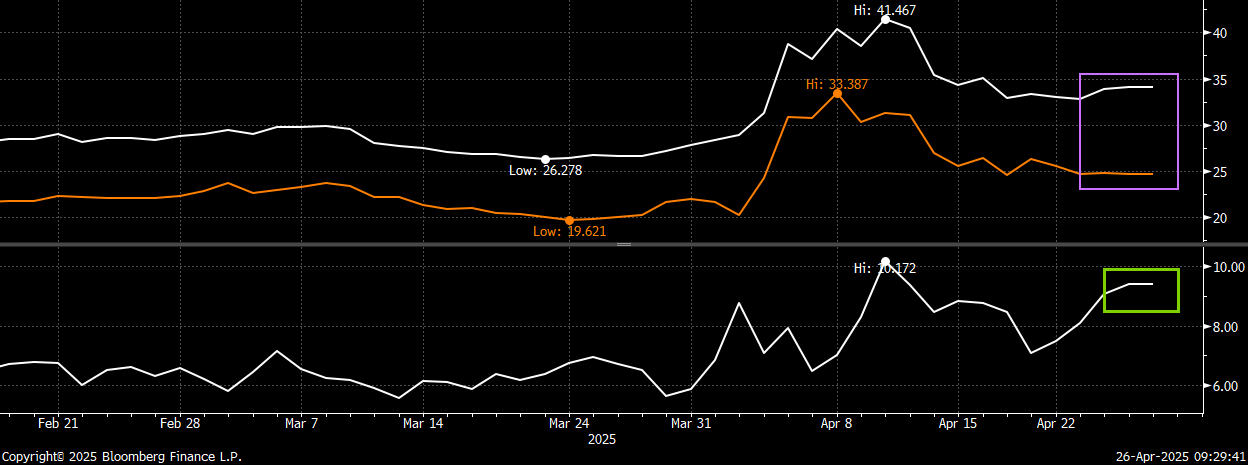
Now that the market (SPY) has rallied nearly 15% from the April 7th lows, and more than 8% just since the lows last Monday, I don’t believe now is the time you want to abandon portfolio hedges. First, the rally in the SPX has taken the main index right up to the support levels from March. That former support is likely to now be some form of resistance, especially after a sharp rally off the lows in a relatively short period of time. Second, we have seen a large drop in volatility as the market has rebounded with the VIX closing last week below 25 (its lowest reading since the day after the tariffs were officially announced after the close on 4/2). The large drop in VIX now means that 1-month (May) 40-delta put vol now trades at a huge discount to both 30-day and 60-day realized vol (this is exactly when you want to own vol). Lastly, while we have seen a dramatic decline in the higher-delta put implied volatility, there remains a decided bid to the “tail” puts after the huge spike we saw in vol on the original market decline in early April. This dynamic of lower vol on the closer to the money (higher-delta) puts while the “tail” puts still have a bid means put skew is now VERY attractive and makes owning wide put spreads here extremely compelling in my opinion (especially as the index sits at a potentially big resistance level).
SPX futures have rallied nearly 15% from the lows (and 8% since Monday) to right below the former support level from March (before the index really broke down)
VIX closed on Friday below 25 (down from a high of 60) and is now at the lows from the day after the tariffs were announced
One month (May) 40d put implied vol is now ~ 23, and trading at a massive discount to both the 30-day and 60-day realized volatility
With the closer to the money put implied volatility down, I am still seeing a large bid on the “tail” puts. Can capture nearly 10 points of vol skew when establishing put spreads
Trade:
Buy SPY May 535 puts (29-delta, 25 vol)
Sell SPY May 485 puts (5-delta, 34.8 vol)
Costs ~ $5.10 (SPY 550.64 Fri closing price ref)
- Buying the May SPY put spread following sharp rally into potential resistance
- As VIX has come down, we have seen put skew move back to just below the highs
- Selling the far out of the money 485 puts covers ~ 17.5% of the cost of buying the 3% out of the money 535 put (SPY was < 510 on Monday)
- Market seems unlikely to just sit at this key technical level for the next few weeks. In addition, market had realized moves of more than 1.55% on 5 of the last 7 trading days (great time and level to own vol)
- Paying less than 1% of the underlying index (SPY) to potentially hedge against a 12% decline for the next three weeks
- Put spread offers a nearly 9x to 1 max payoff on the limited-risk hedge
- Still ok to be in May hedges as there are a full 3 weeks until expiration (market was 9% lower 3 weeks ago) and we will get a lot of economic data as well as earnings over that time (not to mention all the potential tariff headlines)
- Put spread can be added as a tactical hedge, or can look to rollup existing hedges that may now be further out of the money as market has rebounded
- Please contact me or the 22V sales desk for updated pricing and execution capabilities
The limited-risk put spread offers a wide downside range of market protection following sharp rally right into potential resistance

Time to get defensive on the “defensive” consumer staples
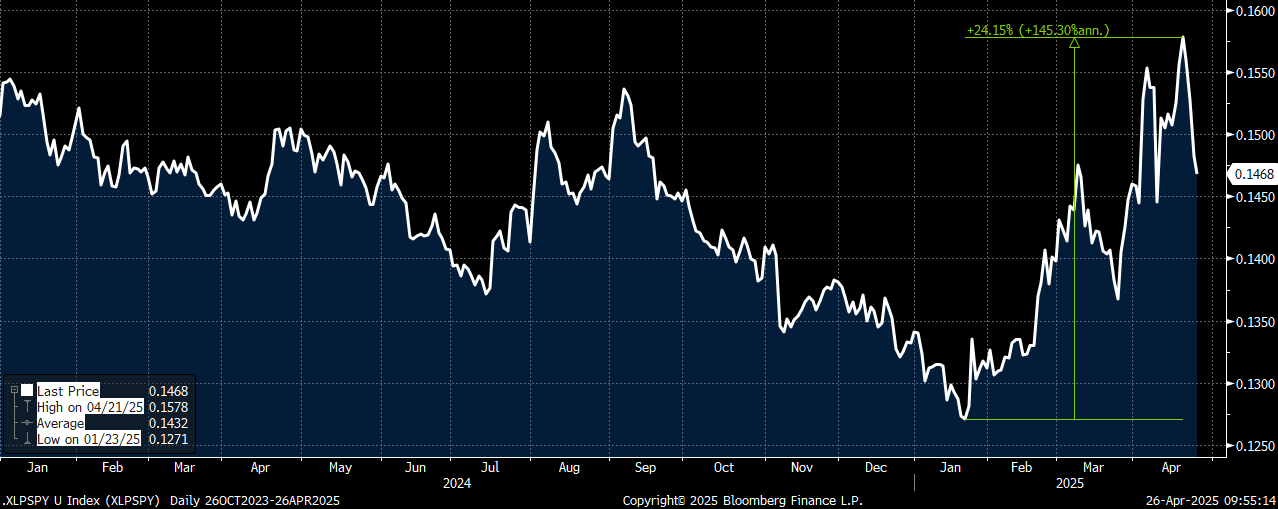
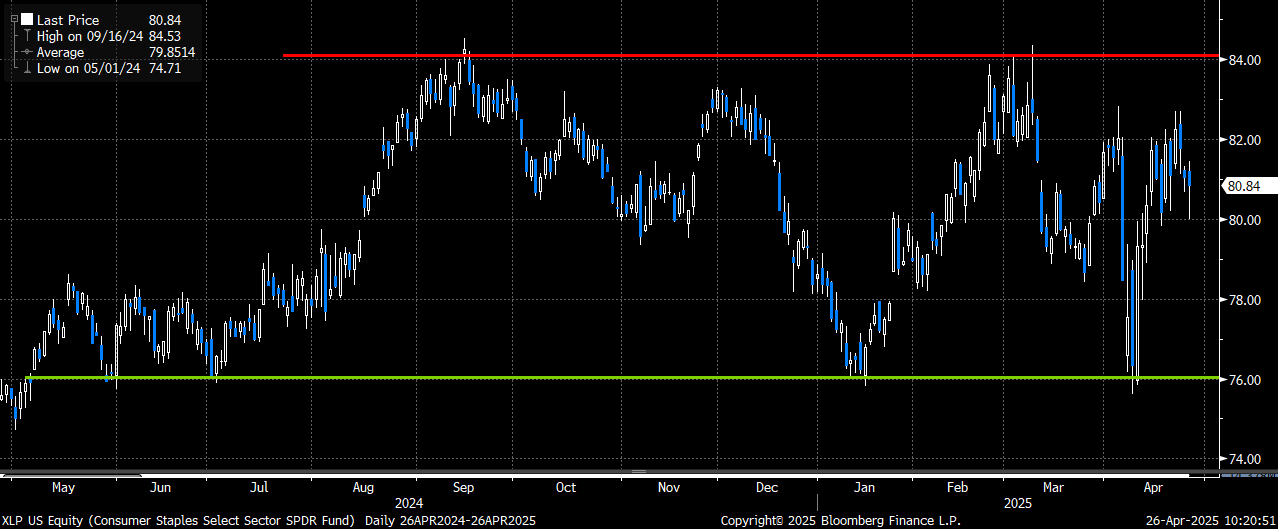
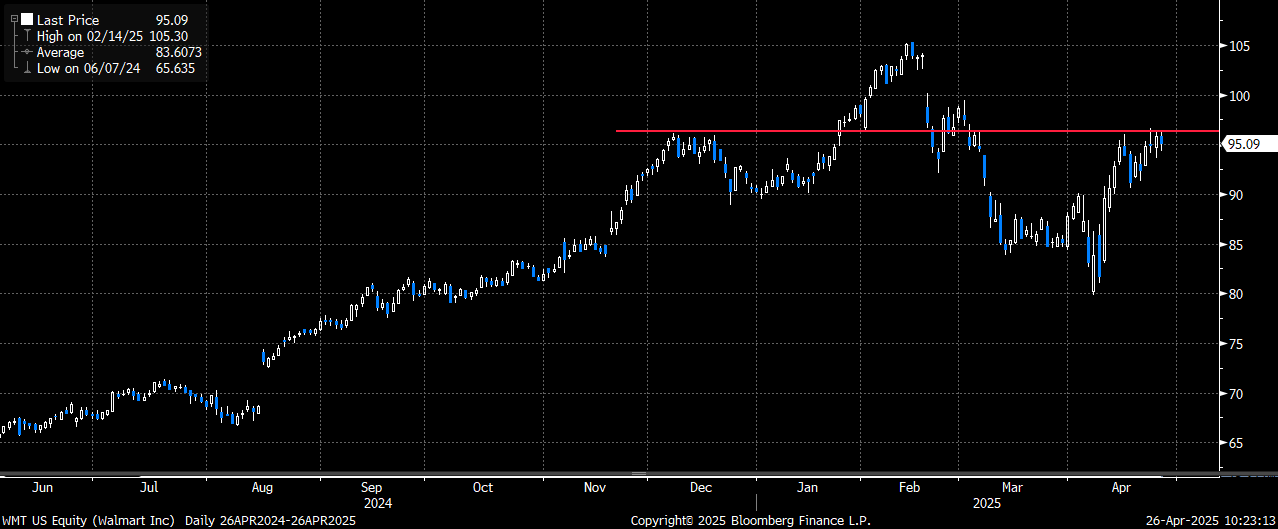
One sector that benefitted mightily from the risk-off trade for most of the year has been the consumer staples (XLP). As money left the higher-beta growth names, it gravitated towards the staples as a place to “hide” in uncertain times. Between late January and late April, the XLP/SPY relative spread was up more than 24%, and was at highs last seen back in 2023. As we start to get earnings from several of the top names in XLP this quarter, there have been many disappointments already (PG, PEP and KMB to name a few). Looking at the XLP chart, it remains in a clear range between 76 and 84, and it appears that XLP may “lose” in several scenarios from here as we continue with earnings for the group. Should the market, and specifically growth, continue to rebound then I would expect further weakness from the group as money that rotated in on the risk-off trade gets moved out. If the market does stall at this resistance level and move lower, we could also see the staples move lower just on market weakness (just like the sharp selloff from 82 to 76 earlier this month). Lastly, the two largest weightings in XLP are Walmart (WMT) and Costco (COST) with both having a nearly 10% weighting. WMT currently trades at ~ 38x and COST sports a multiple of ~ 55x. Both names dropped by more than 6% on their last earnings and have since rebounded from their lows (along with the market) to potential resistance. WMT will report their earnings on 5/15, so owning XLP May downside structures will capture that event. Given this backdrop, I favor adding short-term (May) tactical hedges in XLP at this time.
Trade
Buy XLP May 80 puts 2x
Sell XLP May 76 puts 3x
Costs ~ $0.60 (XLP 80.84 Fri closing price ref)
- Buying the May ratio put spread in XLP to position for further short-term weakness/underperformance thru earnings season
- After attracting a lot of money flows, the sector has come under pressure as weak earnings/guidance, coupled with a rebound in the indexes and growth, has weighed on the sector
- Poor earnings and guidance from names like PG, PEP and KMB could be a harbinger for further disappointments over the next few weeks
- Both WMT and COST (top-2 names in XLP) sold off 6%+ last quarter and still trade at very lofty multiples. After rebounding from their lows into potential resistance, could see those names start to weigh negatively on XLP from here
- Targeting a move back to the 76-support level with the ratio put spread
- Favor the ratio put spread as implied vol remains somewhat elevated and I don’t think a move much below 76 is likely by May expiry
- Trade starts ~ 1% below spot and max payout is ~ 5.7x to 1 at May expiration
- Please reach out to me or the 22V sales desk for updated pricing and execution capabilities
XLP/SPY relative spread moved up by more than 24% from the Jan lows to the recent highs (and is now coming down sharply)
XLP remains in a well-defined range between 76 and 84. Trade is targeting a move back towards the 76 lows
WMT has rallied ~ 20% off the lows (after dropping by more than 6% in Feb on earnings) and is now at potential resistance
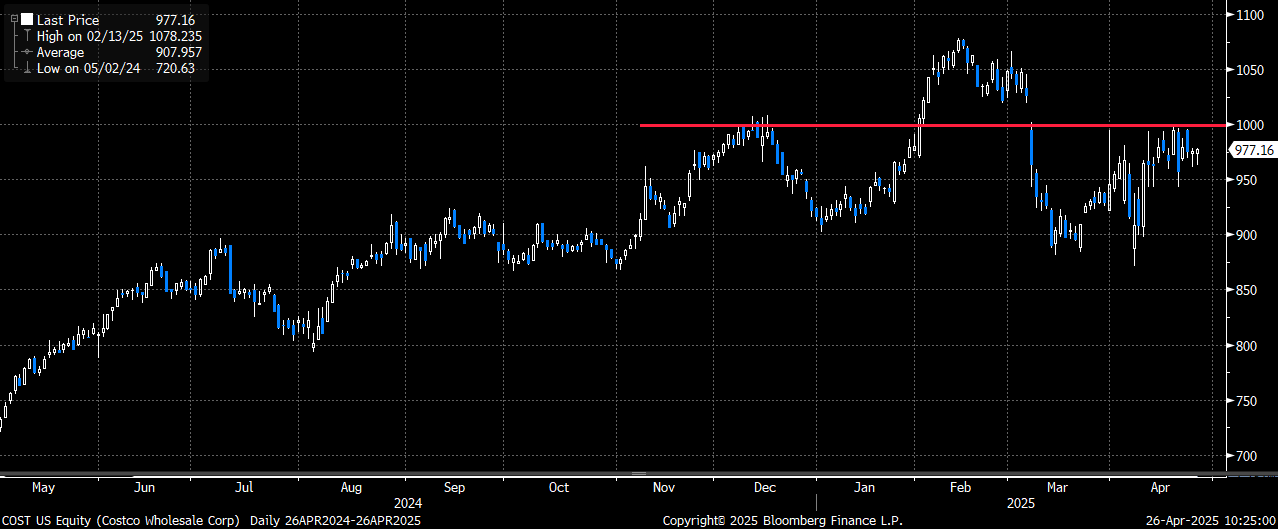
COST (at 55x earnings) with a very similar chart to WMT. It too dropped by more than 6% when they reported in March and is now just below clear resistance