

Following the PPI, some members of what I call the informed consensus took up their estimates of the Core PCE Price Index, by as much as 4 basis points, according to my polling. Others were unchanged or virtually unchanged, although I noticed one firm with a relatively low number implying that their number was held down by their sense of non-market prices. Accordingly, I raise my inference of what the informed consensus is saying for the Core PCE Price Index by just 1 bp to 36 basis points. And I narrow the gap between the Core and the Market-Price Only (MPO) core by 1 bp to 1 bp. I also complete the parsing into goods vs services inflation. Please forgive the false precision involved in all of this. Running a spreadsheet and producing charts preclude rounding.

Source: BEA, FH calculations and inferences
Data are actual to January and estimates for February.
Assuming these estimates are roughly correct, as I do, and the upward revisions will be very small, as I also do, a couple qualitative points will stand out when the PCE price data print at the end of the month. First, the dip of the underlying inflation that showed up in January will be reversed in February. And the Fed will describe inflation as flat, not that it really stopped doing so. In making this point, I refer to the 12-month changes, shown as thick black lines in the chart below, out of respect for the consensus view that there is residual seasonality in the price data and that we can trust only the 12-month changes. That premise makes some sense to me, but it is an hypothesis, not a certainty. So, I do attribute some relevance to the fact that the 3-month rate is running above the 12-month rate for both the Core PCE Price Index and what I call the single best measure.
I should mention that the single best measure has a (hopefully stable) downward bias because it excludes non-market prices, which are volatile but also have a stronger structural trend. So, measured inflation there of 2% would map to underlying inflation of 2 1/4%. Separately, while the single best measure is my preferred, I would readily concede that in the current environment it spots all the benefit of the doubts to the doves. Therefore, the mean is probably to the right of my mode. So, one might say inflation is in a range closer to 2 1/2%. I would not fight that, but I hope it is clear to you what I am doing here.
Second, there is still some weak evidence of continued disinflation in core services, as the bottom right panel of the chart below shows. Note that the 12-month rate there does not quite fully retrace the decline it recorded in January, although the 3-month rate is above the 12-month rate and has quickened a bit. This is offset by a steeper acceleration in the core goods sector, which fits the view that there has been some front running of the tariffs. The fact that the inflation is somewhat concentrated on the goods side is — taken in isolation — constructive, because front running of the tariffs is a one-off, while services inflation is more likely to reflect the cyclical state of the economy and to be more persistent. Of course, this may seem like niggling, given that this one-off effect from front running is going to be replaced by the imposition of tariffs themselves. This point would be more relevant if the tariffs were lifted for some reason, not that I expect that outcome, at least fully.
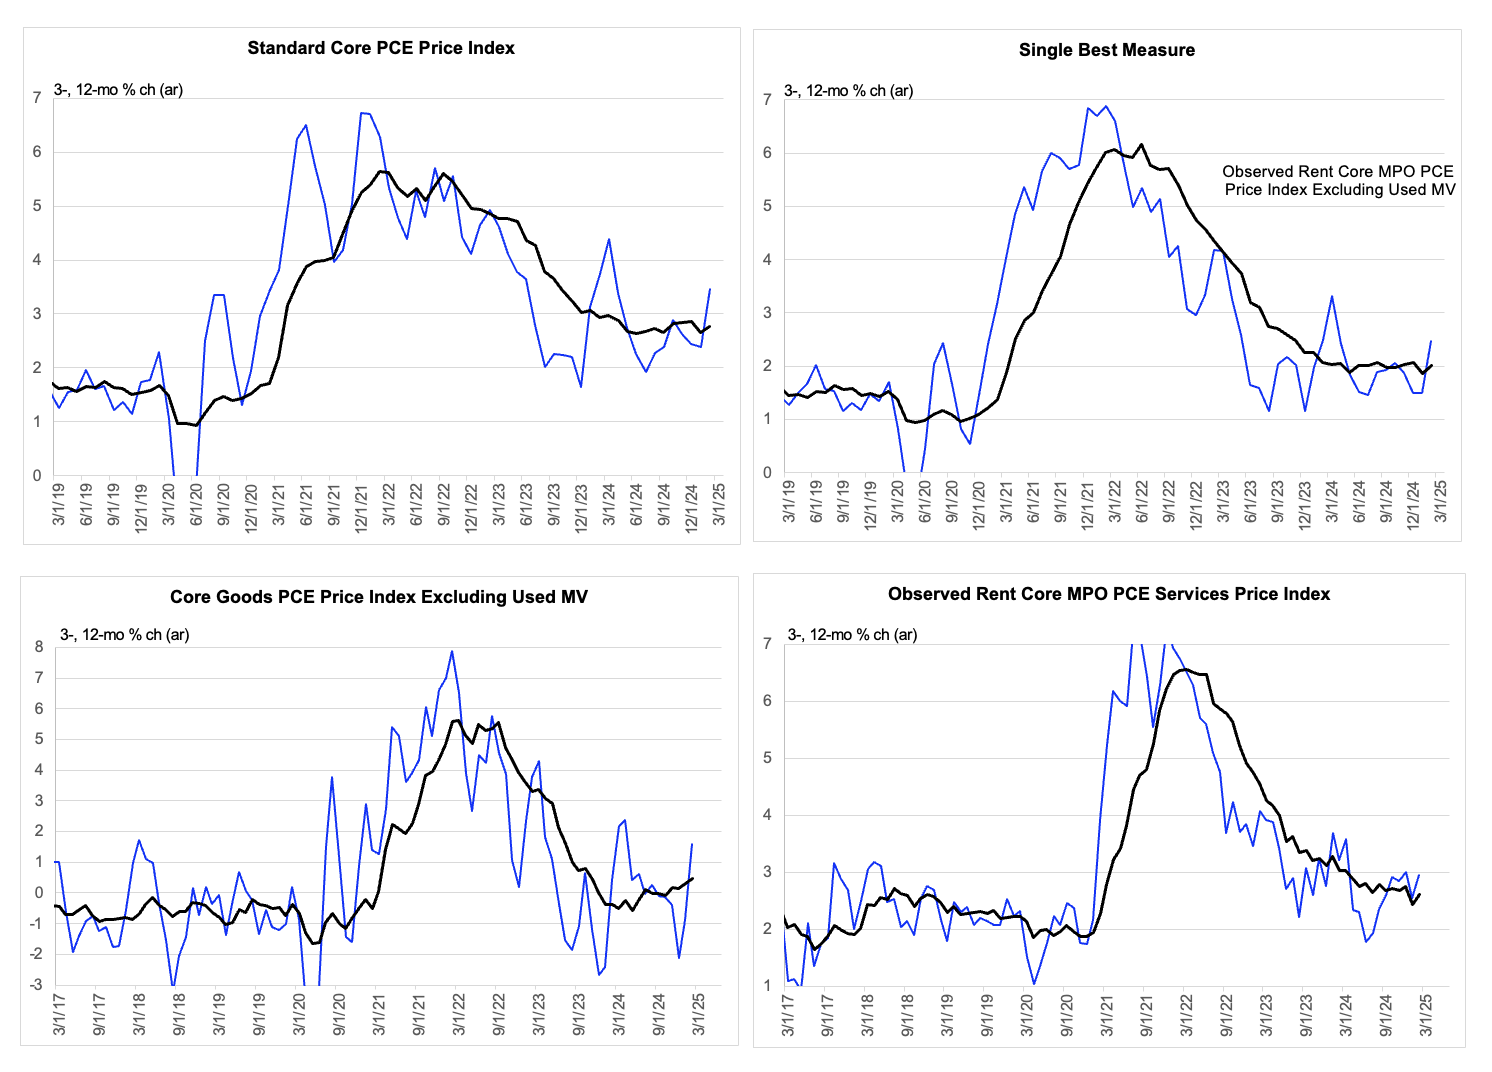
Data are actual to January and estimates for February.

