

Much of the news from the Fed yesterday was the removal of two (not just one) rate cuts from the 2025 forecast and Powell’s follow-up emphasis at the Press Conference that they now need to be more cautious about rate cuts going forward. I would not say that I expected that, but it seemed to be easily within the range of what one might have expected, given the strength of the economy and the state of financial conditions. We might also toss onto the list the threat of tariffs, although that is complicated in a way I will discuss below.
What was surprising to me was the formal 30-basis-point increase in the median core PCE inflation forecast for 2025, from 2.2% to 2.5%. That was interpreted – quite reasonably – as one of the main justifications for the less dovish rates guesses and Powell’s more sober tone. It suggests that the inflation news since the September FOMC has been on balance disappointing, which is an interpretation I would be somewhat hesitant to accept. So, it is reasonable to ask what is going on here?
The medians from yesterday’s Summary of Economic Projections (SEP)

Source: Federal Reserve
The most obvious interpretation is one that I am not fully convinced by. During the three months ending in November, core PCE inflation has apparently run at an annualized rate of about 2.8%, which is clearly well above what the Fed had penciled in back in September for the remainder of the year. If anything, the Fed looked a bit optimistic relative to consensus at the time. In any event, this development explains why the SEP’s median estimate of the 4-quarter change of the Core PCE Price Index at the end of 2024 rose from 2.6% at the September FOMC meeting to 2.8% yesterday. That is straightforward. But the question is why the median guesser on the FOMC decided to extrapolate more than fully that upward revision into 2025, even though most of the strength of core PCE inflation during the three months to November was “technical” and not likely indicative of the underlying trend.
One possible partial reason here is that the unemployment forecast has come down slightly. But that is unconvincing because broader measures of slack suggest that the labor market actually looks easier (if not weaker), a point Powell emphasized during the Press Conference, in a way that sounded mostly correct to me.
Core PCE Price Index and the “Single Best Measure”
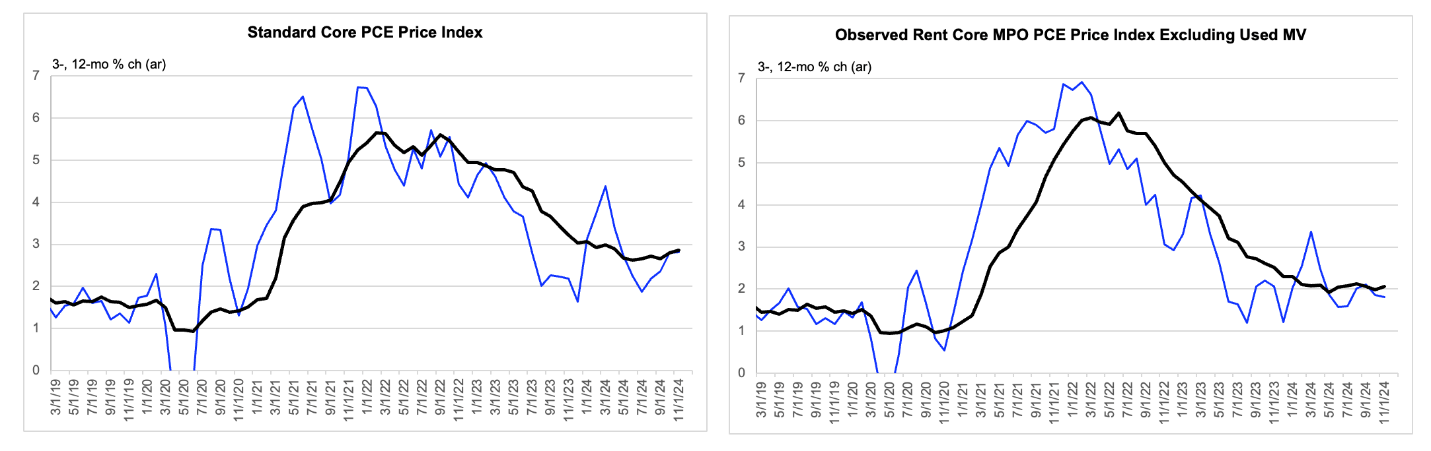
Source: BEA, FH inferences from informed consensus
Data are actual to October and estimate for November. The data to October are subject to minor revisions, which are not incorporated here.
The chart above highlights the role recently of what I would characterize as mostly noise. Note that the rate of inflation in the Core PCE Price Index appears to have quickened recently, including as measured in the 12-month change, where residual seasonality would not be an issue. If anything, Powell understated this development, by suggesting that the 12-month rate is looking “flat”, and that November reading is shaping up to be 2.8%. The latter is plausible, but on my reading of the consensus, it is actually 2.9%.
In contrast, what I would call the “single best” measure of underlying inflation in the goods and services market, shown in the right panel, signals no tendency to quickening inflation, although it does suggest that underlying inflation has stabilized at just over 2 ¼%, which would be quite an achievement if correct – or representative of the truth.[1]
We may be fairly confident that Powell is on board with the logic behind my single preferred measure. During the Press Conference he alluded to stripping out financial services prices, looking past volatility in used car prices, and following private measures of marginal rents, although his discussion of this last point involves a contradiction.[2]
But there is an issue here on which reasonable people might disagree. While the measure shown in the right panel of the chart above is arguably the single best measure of underlying inflation in the goods and services market, it does – in the current environment – spot all the benefit of the doubt to the doves. Maybe we should put some weight on used car prices, financial services prices, and the trend in the government measures of average rents prior tothe abrupt cooling in November.
From my perspective, the more compelling explanation of the Fed’s decision to extrapolate the upward revision of 2024 into 2025 has to do with tariffs. Powell had been insisting that “we” do not incorporate the effects of government policy changes until they are legislated. And yet at the Press Conference he mentioned that some of the FOMC members were explicit that they were (newly) incorporating some effects of tariffs, while others were silent on the point. It is possible, then, that much or even most of the upward revision to the inflation forecast for 2025 reflects folks penciling in the effects of tariffs and then responding to that by dialing up their best guess of the appropriate funds rate. If that is in fact what is going on here, I would not be inclined to fight it. This might be the first whiff of the downside of potential Trump policy making its way into markets. But at the end of the day, it is the actual policy development that will determine how things play out here.
[1] There is a – hopefully roughly stable – downward bias in the single best measure. So if the data there suggest just over 2%, the inference for underlying inflation would be just over 2 ¼%.
[2] Powell mentioned that he was very relieved to see that the heavily lagging government measures of average rents had slowed to the pace of marginal rents during November taken in isolation, because that had been something he was quite “worried” about. The contradiction here is that Powell had earlier been adamant that he (implicitly) agreed with me, that such a deceleration was inevitable with the only question being the secondary one of precise timing. Still, he endorses the idea that we should be using a housing inflation rate of about 2 ½% when thinking about the current underlying trend of broader inflation, just as my preferred measure suggests.

