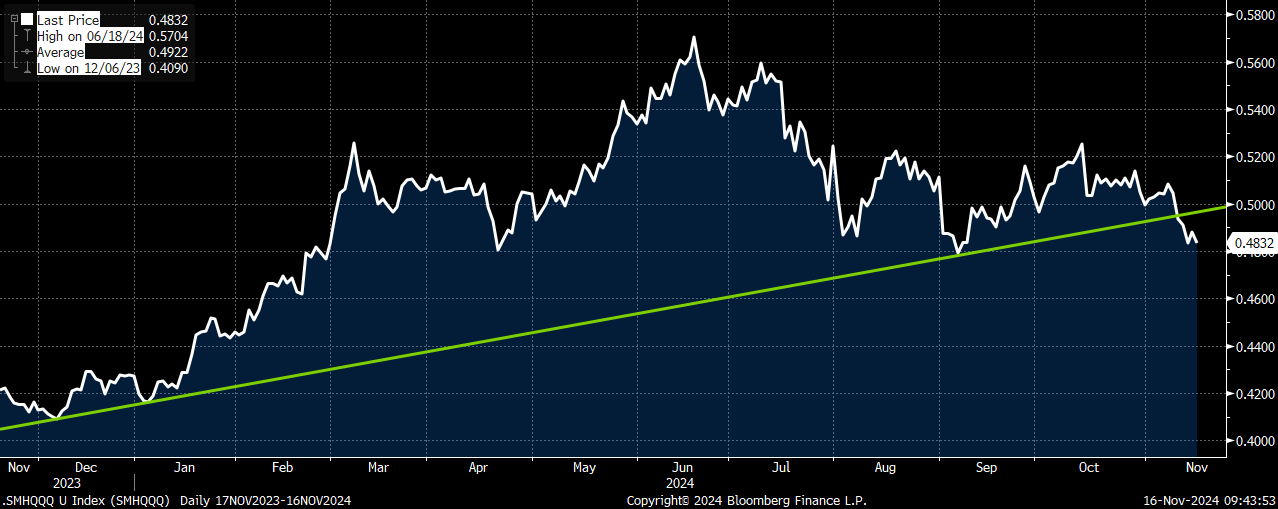
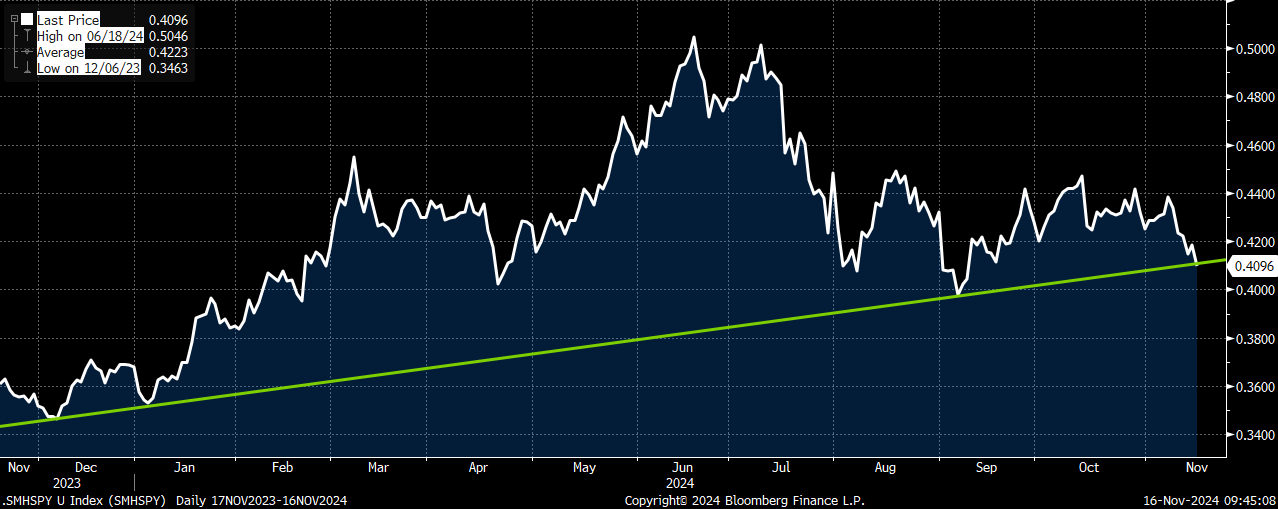
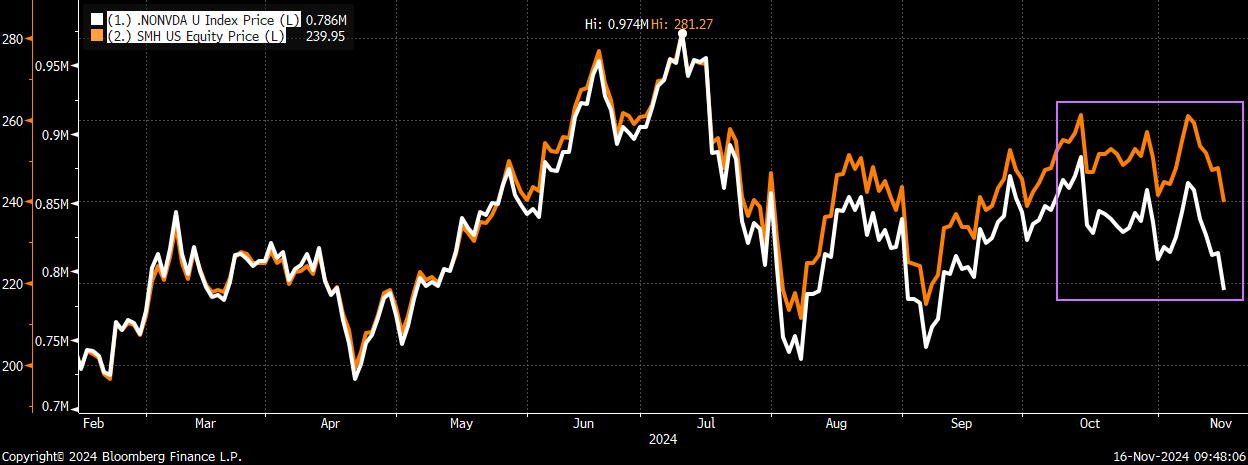
NVIDIA (NVDA) is set to report earnings after the close this Wednesday, and how the shares react will go a long way towards dictating how tech, and specifically the semiconductor names, trade to end the year. As far as some background, the semis were the clear tech and market leaders for most of the first half of 2024. The main semiconductor ETF (SMH) rose by as much as 60% thru June and early July, before peaking on both an absolute and relative (to both QQQ and SPY) basis. Since then, not only have we seen SMH decline but it has lagged both tech (QQQ) and the overall market (SPY) by a considerable amount. The SMH/QQQ relative spread has already broken below the 1-year uptrend (chart below) and the SMH/SPY relative spread is also on the brink of a significant break as well (chart below). I would also argue the strength in NVDA is masking just how weak the overall semi trade has been. NVDA is by far the largest weighting in SMH at 23.65%, and even with all the weakness we have seen in the chips trade, NVDA is only 5% below the YTD (and all-time) highs that were hit last week. I recreated the SMH (ex-NVDA weighting) to show how much the NVDA impact has “helped” the SMH trade (chart below).
SMH/QQQ relative spread with a clear break below the 1-year uptrend support
SMH/SPY relative spread sitting right on the 1-year support
SMH (orange) would be performing far worse without NVDA (white)
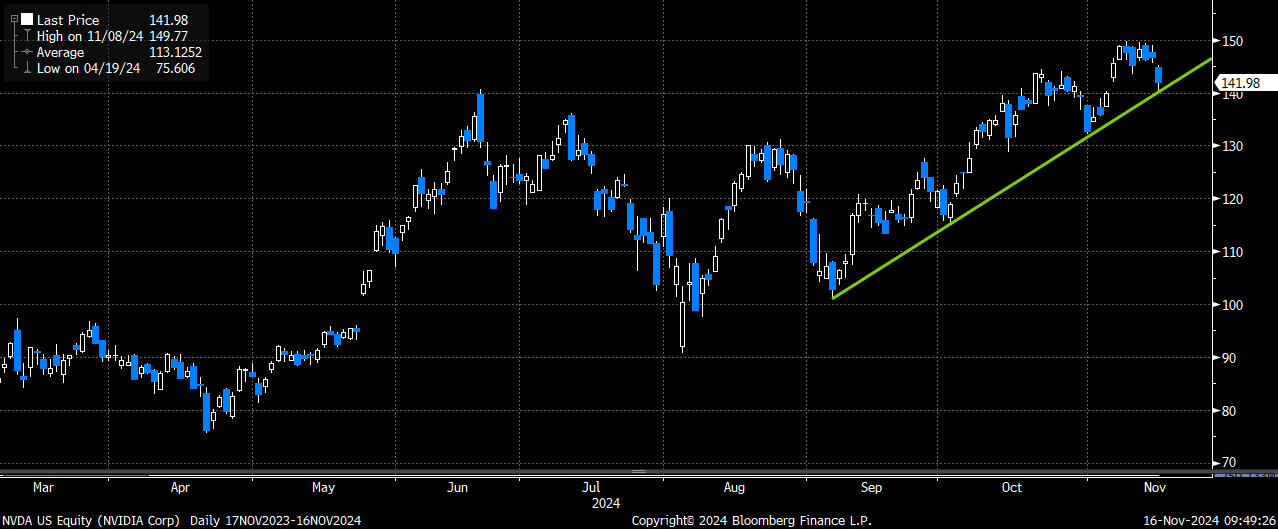
Ahead of the earnings, NVDA shares are sitting right on the 3-month uptrend support line (chart below). A break below that level likely would validate the weakness we have seen in the semi trade and should continue to put pressure on both SMH and tech in general. While investors can hedge exposure by using NVDA options directly, I also wanted to point out two ETF trades I favor that can also be used to not only hedge NVDA exposure, but the overall semi and tech trade thru year-end.
NVDA shares sitting right on their recent support
Trade #1 – SMH put spread collar trade idea
Sell SMH Dec 260 calls
Buy SMH Dec 235/210 put spread
Costs ~ $2.75 (SMH 239.95 ref)
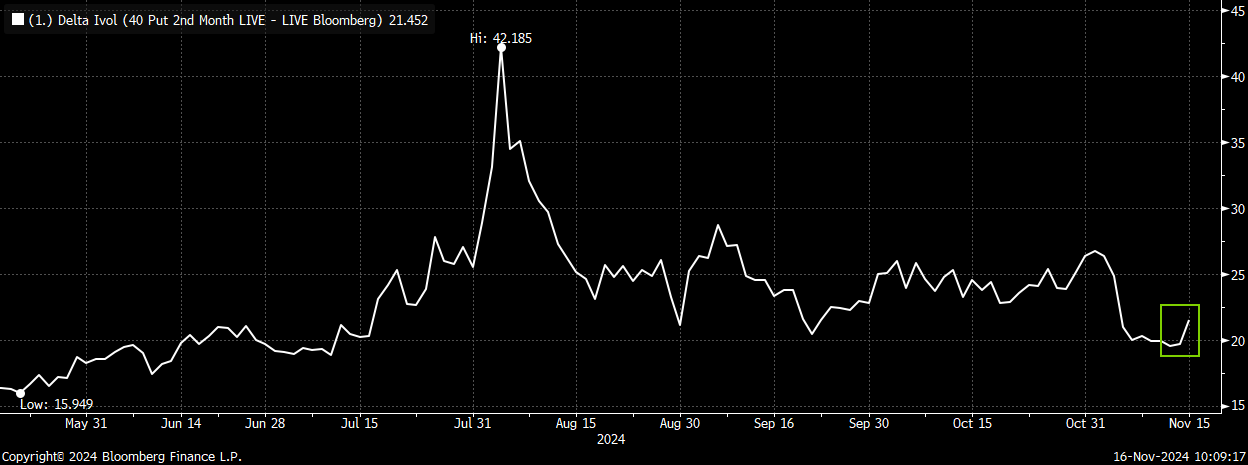
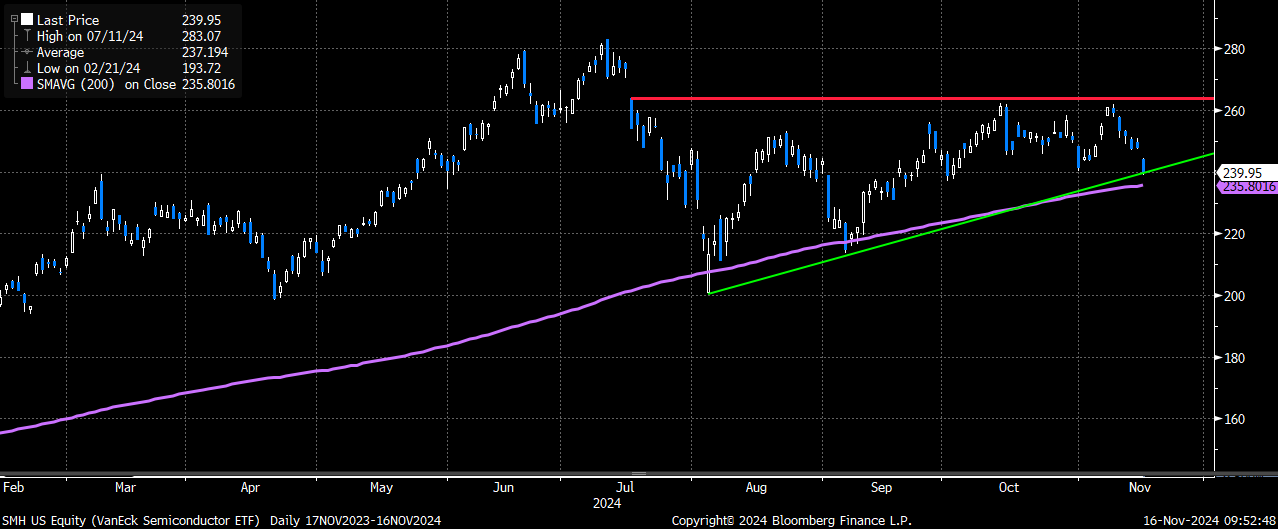
Selling the 8%+ upside calls (at the new resistance level) to buy the 25-point wide protective put spread that starts ~ 2% below spot (and right below the 200-day moving average). I like this structure because even if NVDA stock reacts positively to the earnings, it seems unlikely that SMH makes a new short-term high (above 260) given all the weakness we have seen on earnings from the other notable companies in SMH that have already reported. In addition, SMH put vol (which we are buying as part of the collar) currently trades back at the cheapest levels to NVDA vol (chart below). Selling the upside call covers more than half the cost of owning the closer to the money put spread. The put spread is capped to the downside below the September lows, and trade has a potential max payoff of ~ 8x to 1 to the downside.
SMH chart – selling the Dec 260 calls (at the recent highs) to buy the Dec 235/210 put spread – targeting a break below the August uptrend and 200-day support
SMH 40-delta put vol trading at cheapest skew to NVDA 40-delta put vol (bottom chart)

Trade #2 – XLK December put spreads
Buy XLK Dec 225 puts
Sell XLK Dec 205 puts
Costs ~ $3.20 (XLK 228.71 ref)
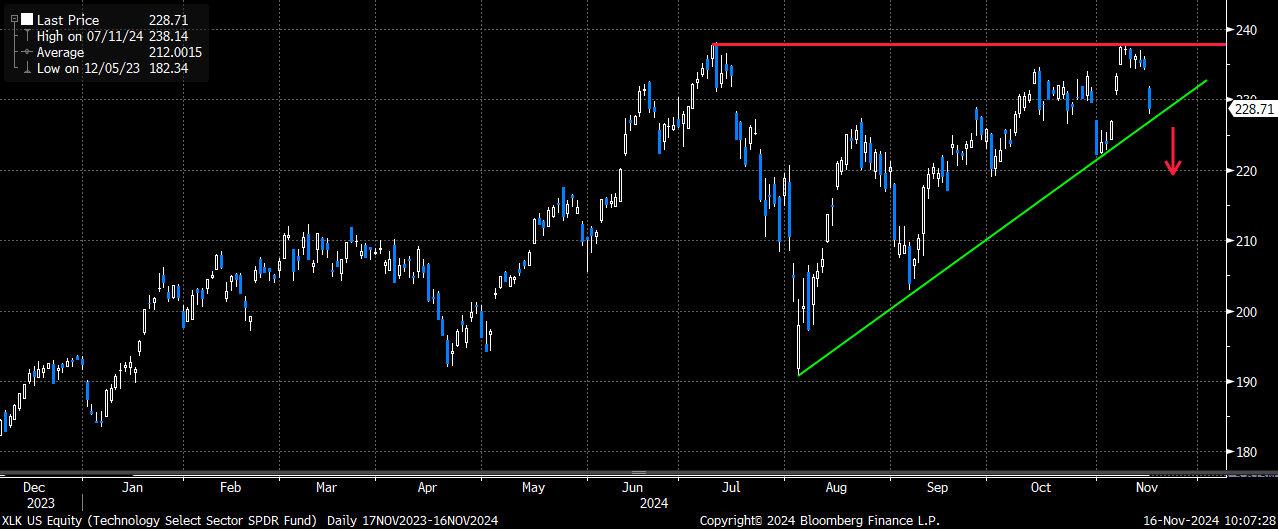
Buying the December protective put spread that starts 1.6% below spot. Trade offers a better than 5x to 1 max payout at Dec expiry. I prefer XLK hedge to the more “traditional” QQQ hedge for NVDA earnings as XLK has nearly DOUBLE the weighting (14.60 vs 8.72 in QQQ). XLK also has a much higher weighting in both AAPL and MSFT (2 stocks that continue to be major tech laggards). On a technical basis, XLK has potentially made a “double top” after re-testing the July highs, and if NVDA disappoints XLK should likely break below the August uptrend support (chart below). Lastly, XLK 1-month (Dec) put vol has pulled back from the recent highs and is now just above the recent lows (chart below).
Please reach out to me directly, or the trading desk for updated pricing and/or execution on either idea.
XLK chart – potential double top at the July highs and risk of a break below the August uptrend should NVDA disappoint
XLK 1-month 40-delta put vol just above the recent lows