

Where Are the Vulnerabilities? Baseline Optimism and Shifting Some Recession Risk into a Third, Nervous (or Nauseous?) Landing, Outcome
- The US labor market has clearly eased, and all eyes are focused on whether or not the US economy is about to slip into a recession.
- The private sector seems to lack obvious vulnerabilities, besides those stemming from the current setting of the fed funds rate (which the Fed intends to recalibrate over the coming months) and the easing in labor market slack, which could still endogenously spiral.
- In the macro data, there are minimal signs of current over-investment, weak balance sheets, or recent easy lending conditions.
- Many parts of the economy already went through over-extension and retrenchment during the post-pandemic cycle.
- The absence of macrofinancial vulnerabilities is a reason for base case optimism and shifts some recession risk that might otherwise be there into a 3rd nervous, perhaps nauseous is more apropos, landing scenario.
- In this scenario, the labor market eases more than expected (taking the unemployment rate towards or a bit above 5%) as labor supply continues to grow rapidly while activity growth is at or a bit below trend, labor demand growth is quite sluggish-but-positive overall and narrow sectorally, and layoffs don’t spike.
- The lack of current over-extension points towards a quite modest recession if one does take place (think a 1-2% fed funds rate, not a return to ZIRP).
- Some RoW experiences post-covid suggest that labor market easing with positive-if-sluggish demand and employment growth is possible even that hasn’t happened in recent US cycles.
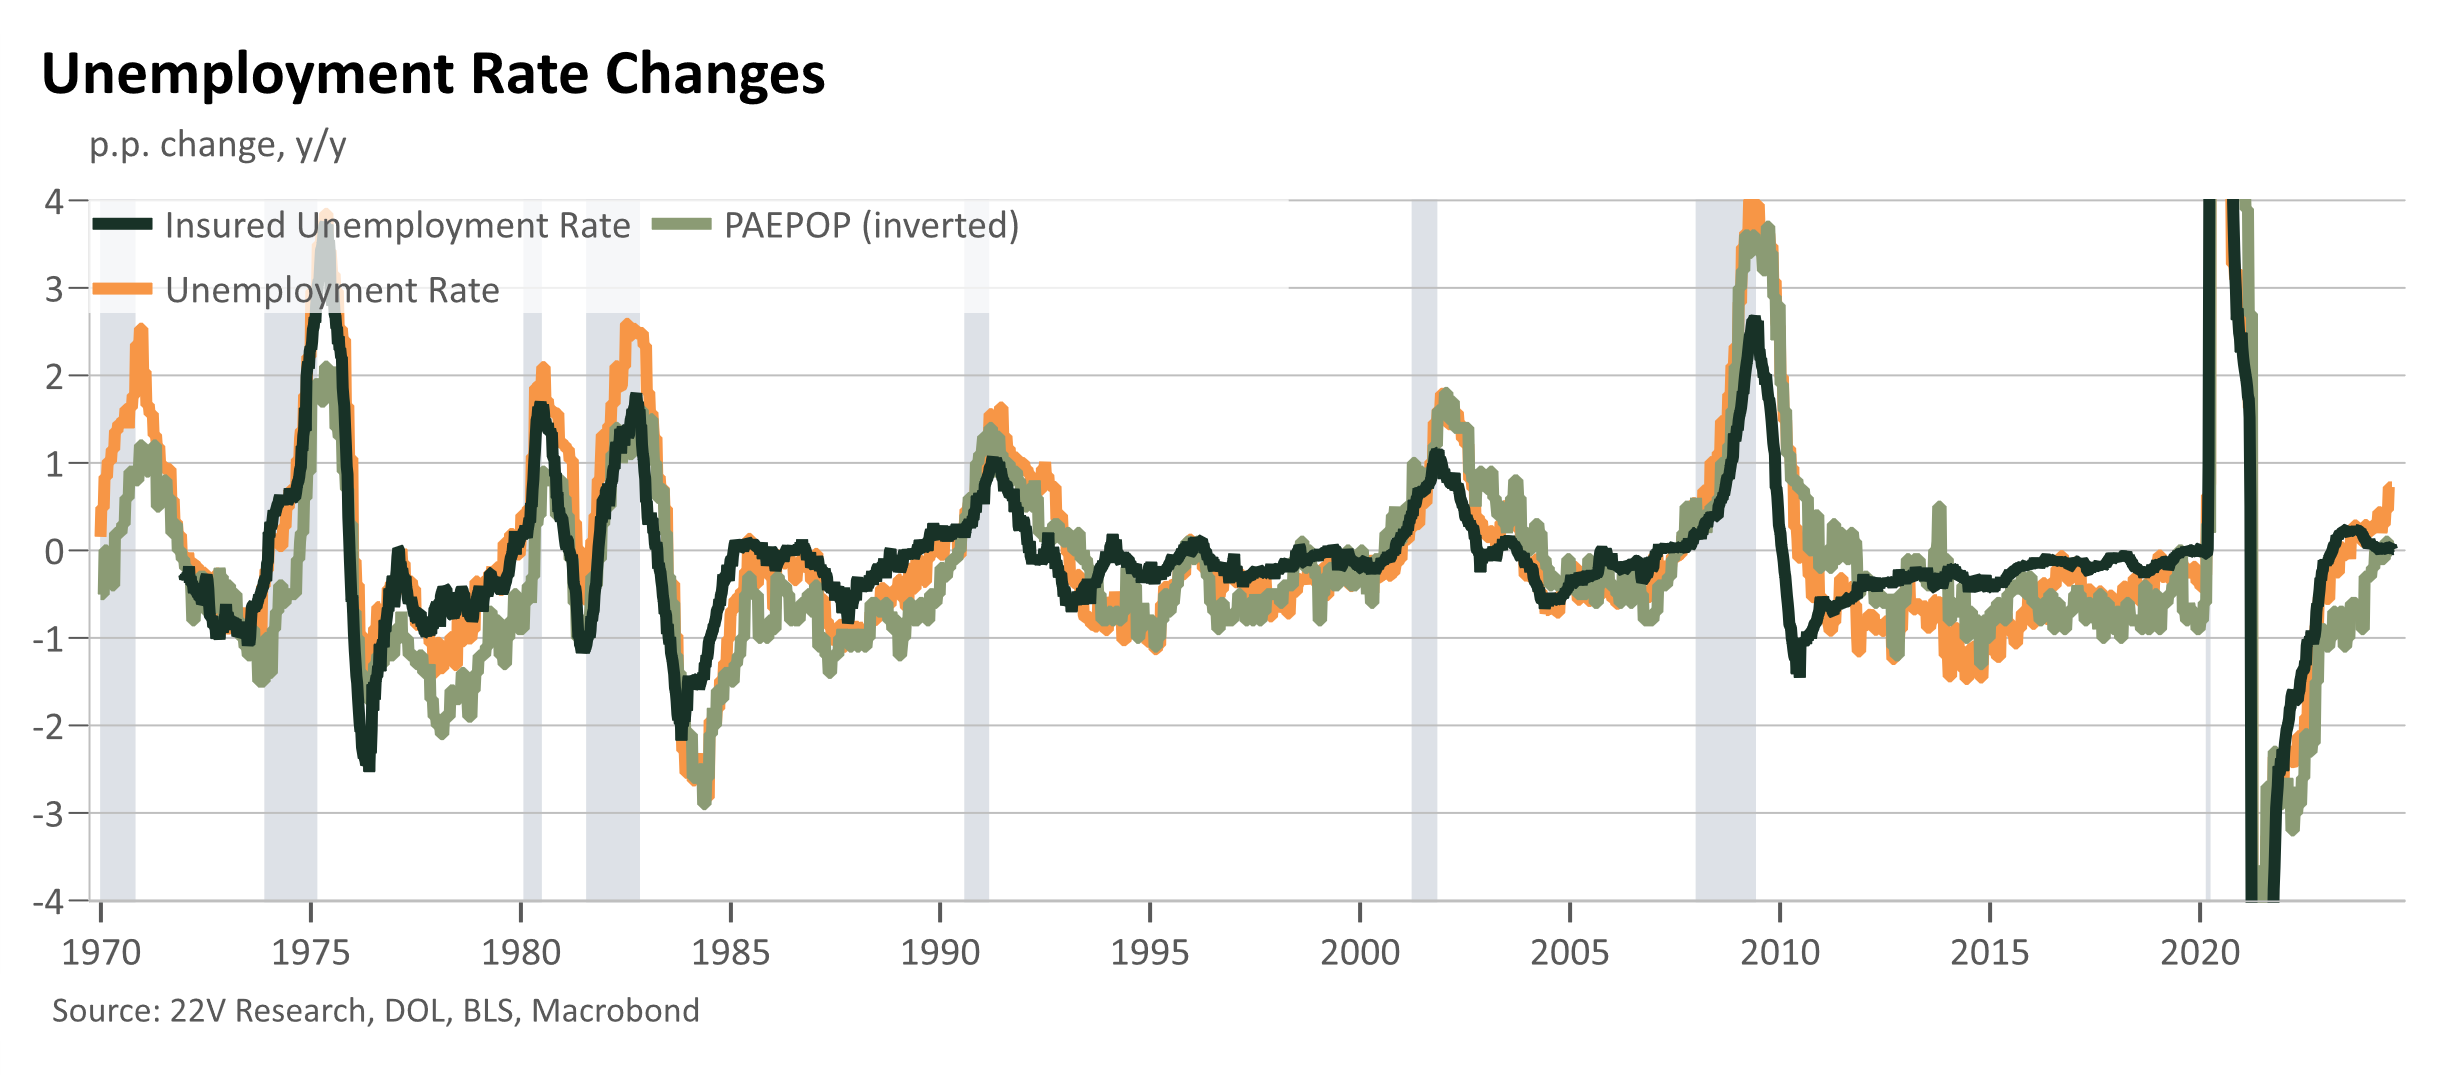
When discussing vulnerabilities in the US economy, the most obvious one has been the increase in the unemployment rate. This is so far happening without a notable rise in layoffs and seems to be largely due to an increased labor force (due to immigration and participation gains) rather than an outright deterioration into demand weakness. We can see this because NFP growth remains positive y/y, jobless claims (initial or continuing, relative to population) are down slightly, and the prime-age employment to population rate is still at its cycle highs.
The real vulnerability here, in the sense of expectations about the future that can be falsified, is that after 18m of anemic hiring in many sectors firms decide they need to proactively reduce headcount. Yes, an absence of hiring can lead to soft unemployment rate outcomes but those outcomes for labor force (re)entrants are unlikely to enough to pull the broader economy into a recession on their own unless firms start reducing headcounts more aggressively, through attrition or layoffs. This is admittedly a bit of a philosophical debate on whether supply-driven slack can cause a recession in the same way that demand-led weakness can.
That is the labor market backdrop. Certainly, it is a confusing one, especially coming after the hiring binge of the reopening period and the stasis in many industries since, which allows for a myriad of interpretations, hence the general environment of (pre)recessionary concerns and asymmetric reactions to any softness. That has been well covered.
When framing recession and crisis risks we have to move beyond the contemporaneous indicators of activity (largely fine given overall growth) and the labor market (where the pessimism mostly resides but indicators are mixed), and think about how a loosening in slack would be transmitted into a broader recession. Yes, there is some risk that a purely endogenous nonlinear easing in slack could cause a recession, but classically recessions come as demand has already started easing, a shock happens (energy prices spice, the housing market rolls over, etc), and then vulnerabilities transmit that shock to the rest of the economy.
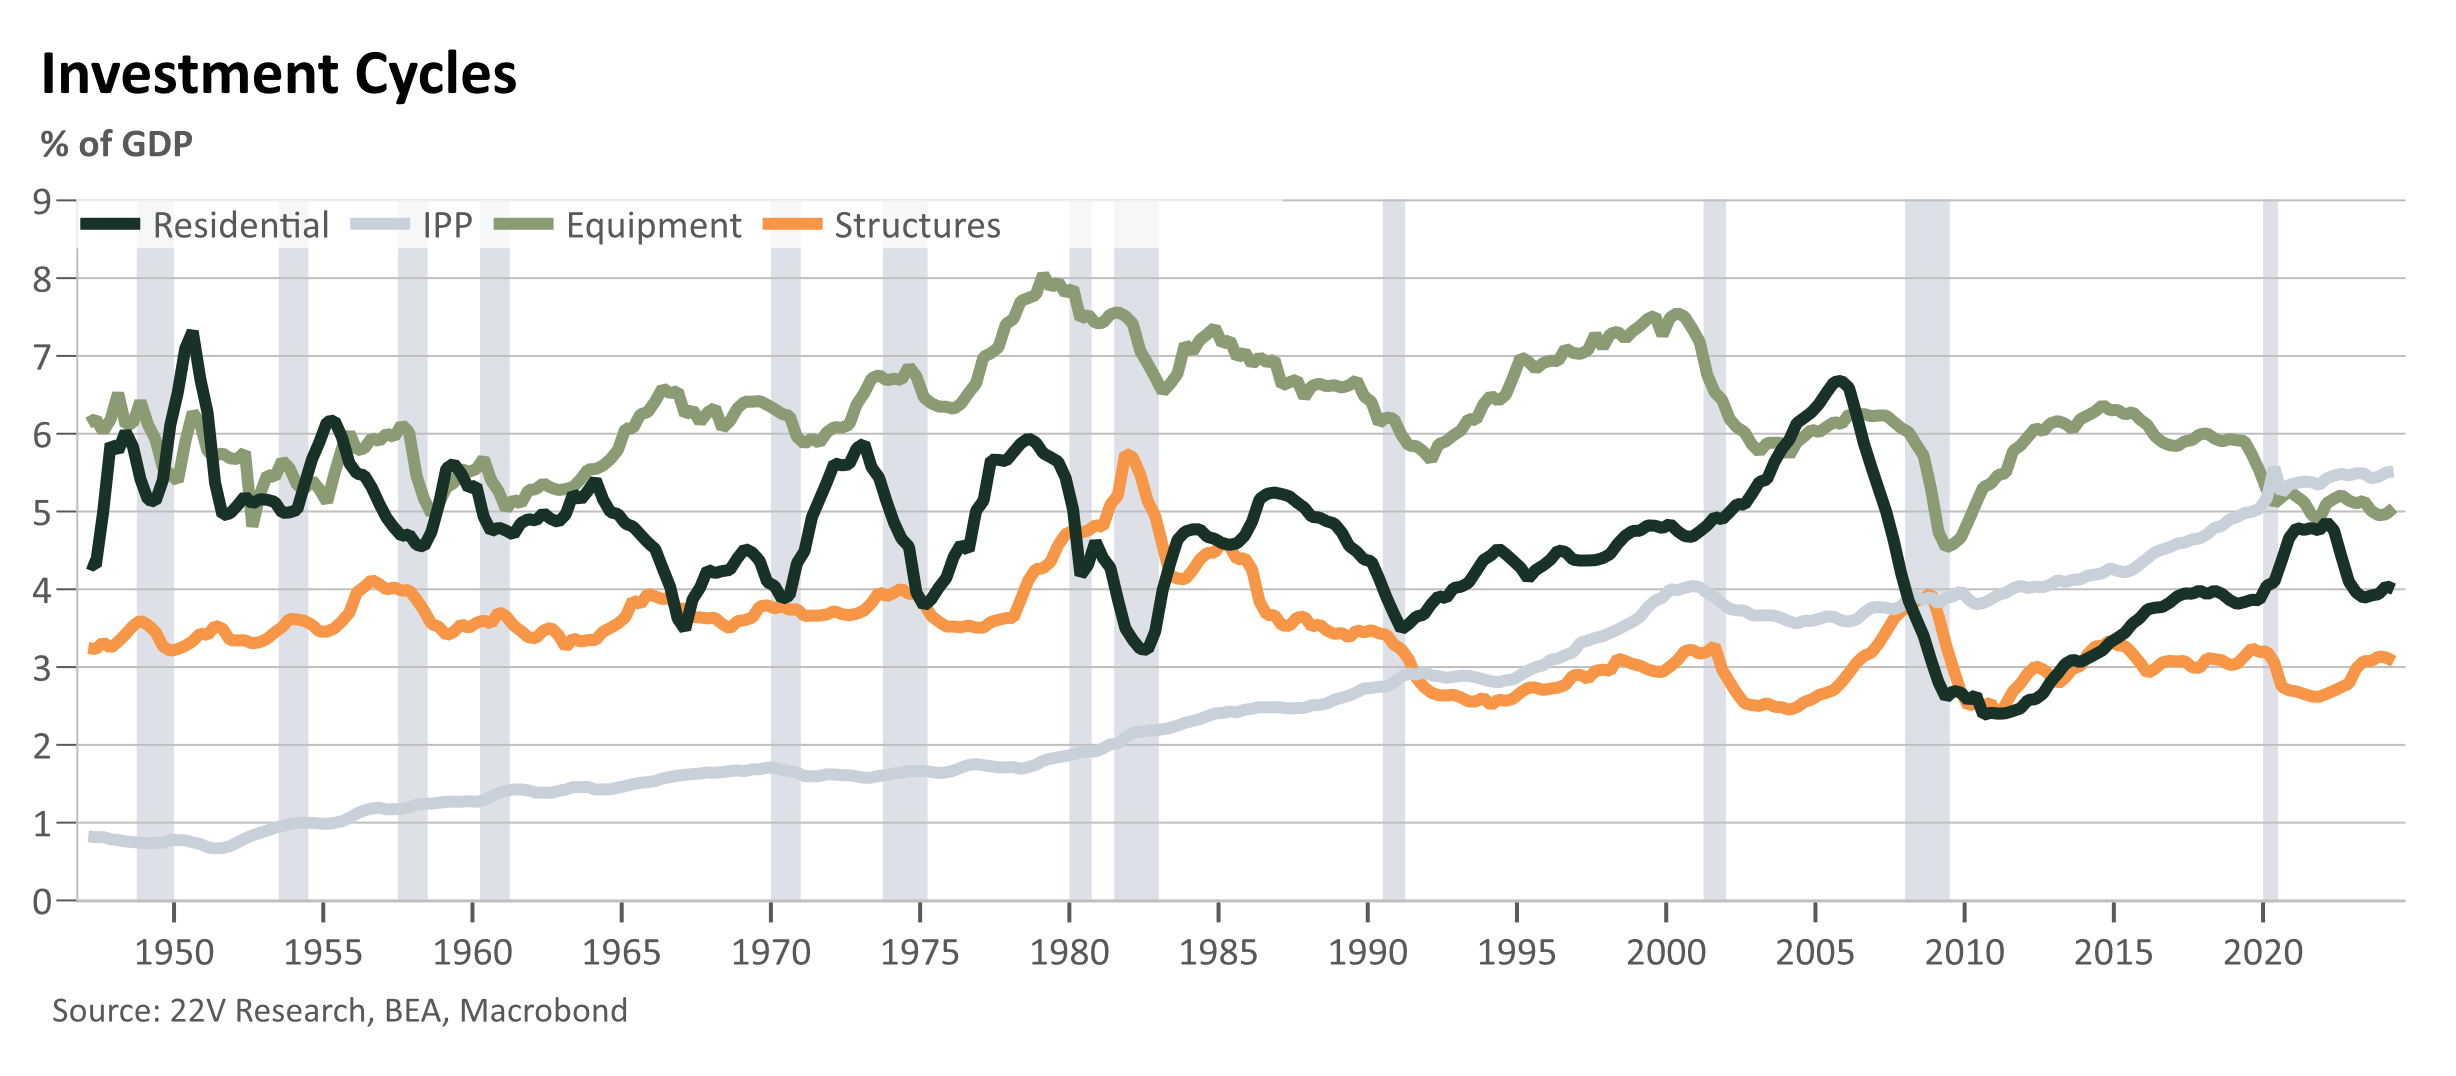
When looking at the behavior of investment across both the corporate and household sectors it is hard to see much that looks stretched and prone to a possible rollover. Indeed, in most sectors investment has either been sluggish since covid period or rolled over following the rate hike cycle. Equipment investment has been the most anemic post-covid and is in a secular, but still procyclical, downtrend. Intellectual property products have been stealing share from equipment but has, so far at least, tended to be notably less cyclical in its behavior than equipment spending. Some of this could be an artifact of conventions in the national accounts but more likely it yet another example of the decreasing cyclicality of the US economy as it has progressively moved towards a greater emphasis on services spending relative to goods.
Residential investment seems likely to be in the doldrums for a while longer yet given the only gradual impact of rates on spending activity and the still substantial affordability challenges that house price gains over the past few years have led to. Still, it seems unlikely that residential investment will be a substantial source of drag either given the broad contours of the rates outlook, the under-production of housing the past few years, and the pent-up demand for moves and existing sales.
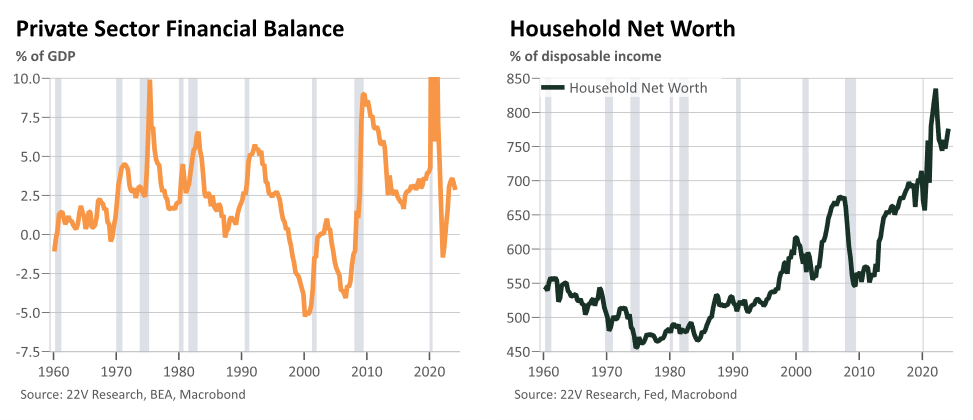
The private sector’s balance sheets and financial sector balances look remarkably robust for this point in the cycle. The private sector financial balance, which measures the accumulation of assets by the private sector, has turned down a bit in recent quarters but remains sharply positive and at a level which suggests little near-term over-extension. This is less positive than it was perhaps but still a optimistic data point.
Household net worth continues to climb as well; the record here is more mixed before but the post-covid net worth gains to household, particularly from real estate (where MPCs from wealth are largest and most robust), are durable sourced on increased spending power. Since the pandemic hit, gross housing wealth (+15.8tn through 24Q1) and the minimal debt increases (+2.6tn) amount to an increase in consumption of between $650bn and $850bn using fairly standard estimated MPCs.[1] Given the minimal mortgage equity withdrawal in recent years due to high rates, one should reasonably expect that some portion of this wealth shock remains unspent. Looking at total changes in net worth since the pandemic hit suggests an even higher consumption boost, on the order of 1.3-2.2tn. Given that wealth gains are often spent on durables good purchases, including housing related purchases, the general stagnation of the housing market in recent years points to large potential future catchup effects as well. Trying to pinpoint these seems like a fraught exercise but the direction is clear and the remaining magnitude, seems significant as well.
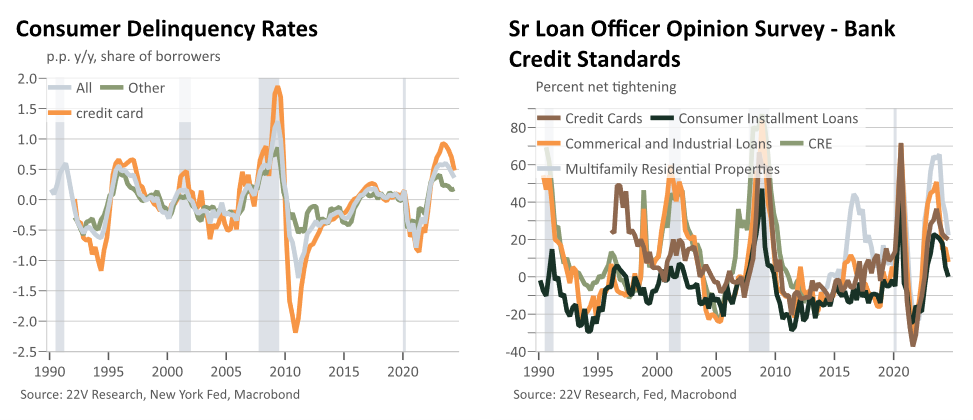
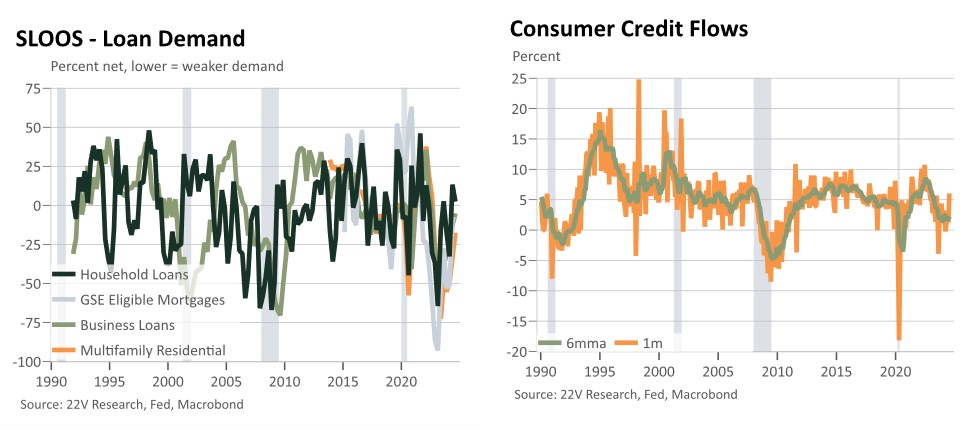
While it is certainly making lots of headlines today, the credit cycle seems much closer to its later innings than its beginning ones. After what were excessively easy lending conditions, partly reflecting stimulus and loan forbearance during the pandemic, in 2020-22 the past 8-10 quarters have seen the largest ever non-recessionary tightening in the senior loan officer survey’s measure of credit standards. This has come as those early overly optimistic loans have seen struggles and delinquency rates rose notably, most especially for auto loans and non-major credit cards. However, this belt tightening has already happened and actually has served to robustify the economy as the labor market has normalized. Indeed, banks seem to be starting to ease standards ever so slightly in level terms and loan demand is starting to creep up as well. The strength of growth in the absence of much credit extension over the past 6qtrs will become a positive tailwind to growth if the economy can make it into 2025 without a recession and is also somewhat near-term optimistic.
Typically, estimates for housing gross wealth gain around are 0.06-0.08, while for mortgage debt the MPC is somewhat higher. The MPCs on net worth gains tend to be 0.05-0.07. For total net worth, MPCs are usually 0.03-0.05. ↑

