

This note elaborates on a theme I set out briefly on Friday, after the May employment report. The mixed labor market data look benign, but they are not necessarily dovish.
Interpreting Friday
The unemployment rate has been trending higher for over a year now, and the 10 bps rise on Friday was a legitimate surprise that has concentrated minds. This trend probably does indicate that the labor market has been easing (rather than merely “rebalancing”), just as the moderate hawks insisted would likely be required to restore price stability.
However, with the advantage of hindsight especially, the hawks turned out to be wrong in their claim that demand growth would have to slow dangerously to achieve the result. In the event, a combination of an easing labor market and strong demand growth has apparently been made possible by a surge in the labor force driven by an acceleration of largely undocumented immigration over the past couple years. The labor force spike has not been recorded in BLS’s employment data, as I will get to below, but it has nonetheless been extremely well timed from a cyclical perspective. By this point in the story, that should all be noncontroversial, at least qualitatively.
The more interesting debate revolves around what this cyclically benign rise of unemployment has to say about the outlook for inflation, the effective stance of monetary policy, and the path of the fed funds rate. There is more room for debate here, and we should continue to maintain an emphasis on data watching, rather than leaning heavily on priors which can be appropriate in other settings. But my own inclination remains to lean hawkish on these issues, for reasons I explain in the remainder of this note. Incidentally, this note is a bit long, especially by my recent standards. If you are interested in saving time, you already have its conclusion.
Summary evidence of strength in the establishment survey
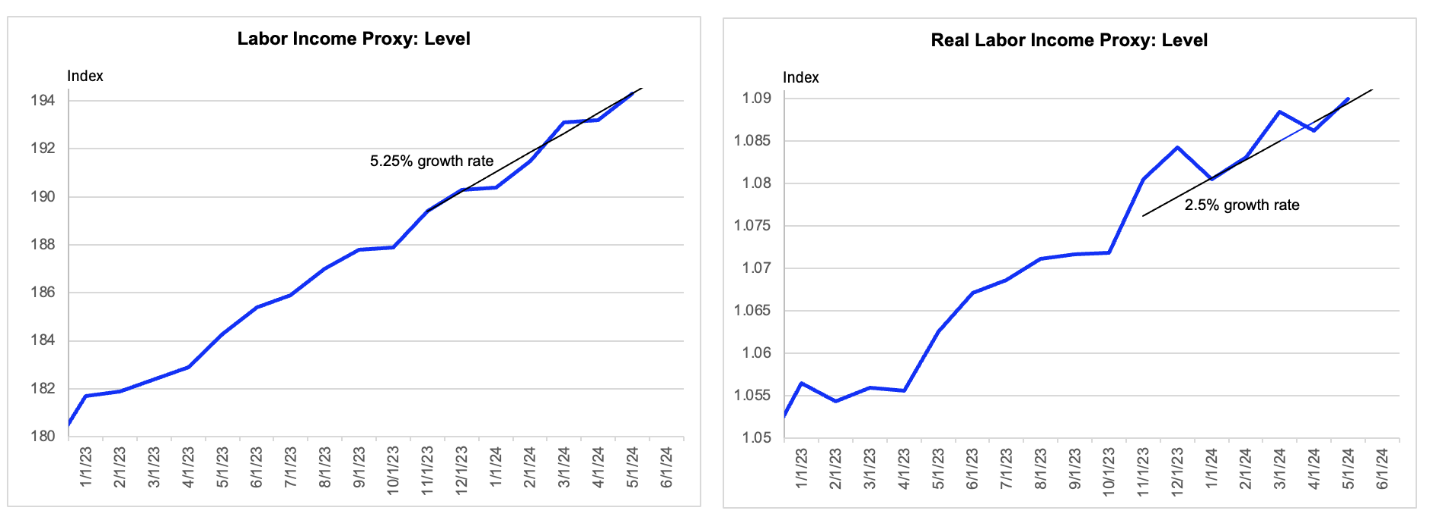
Labor income data are actual to May. The headline PCE deflator used to deflate them is actual to April and estimated up 25 bps for May.
Away from the household survey, things look strong
Let’s start with a very quick summary of how aggregate demand growth is behaving. The news on this front was encouraging last week, including the detail in the establishment survey within the employment report. Private employment beat slightly inclusive of revisions and average hourly earnings beat more meaningfully. Given an unchanged average workweek, this allowed the so-called labor income proxy (the product of employment, wages and hours) to rise 57 basis points or 20 basis points more than the consensus expected. As a result, the labor income proxy now looks to be growing at a trend rate of about 5 ¼%, which is obviously very strong. After adjusting for inflation, the trend there looks quite a bit weaker, but we all presume that the recent heating up of headline inflation is not itself a trend. If we are wrong about that, then we will have other worries.
Separately, the nonmanufacturing ISM was quite strong during April, and perhaps more so than has been widely recognized, as I mentioned in a note last week. And the auto SAAR at least managed not to miss. Mainly in response to these developments, the Atlanta Fed’s GDPnow tracking took up its estimate for Q2 GDP growth by 1 ¼ percentage points during the last four days of last week. The GDPnow estimate is hardly authoritative, but the delta should be roughly in line with how the consensus is moving, particularly at – or beyond – this stage of the quarter.
The Atlanta Fed now has final sales to private domestic purchasers, often taken as the “core” of aggregate demand, rising at an annualized rate of about 3% during the Q2. That would follow an equal gain during Q1, which show a nice acceleration from the 2 ¼% growth rate now recorded for the second half of last year. And yet, the labor market has been cooling, as evidenced by a rising unemployment rate and an associated decline of the employment / population ratio, reflecting that the cyclical recovery of the labor force participation rate has also stalled.
Core aggregate demand growing faster than the long-term trend
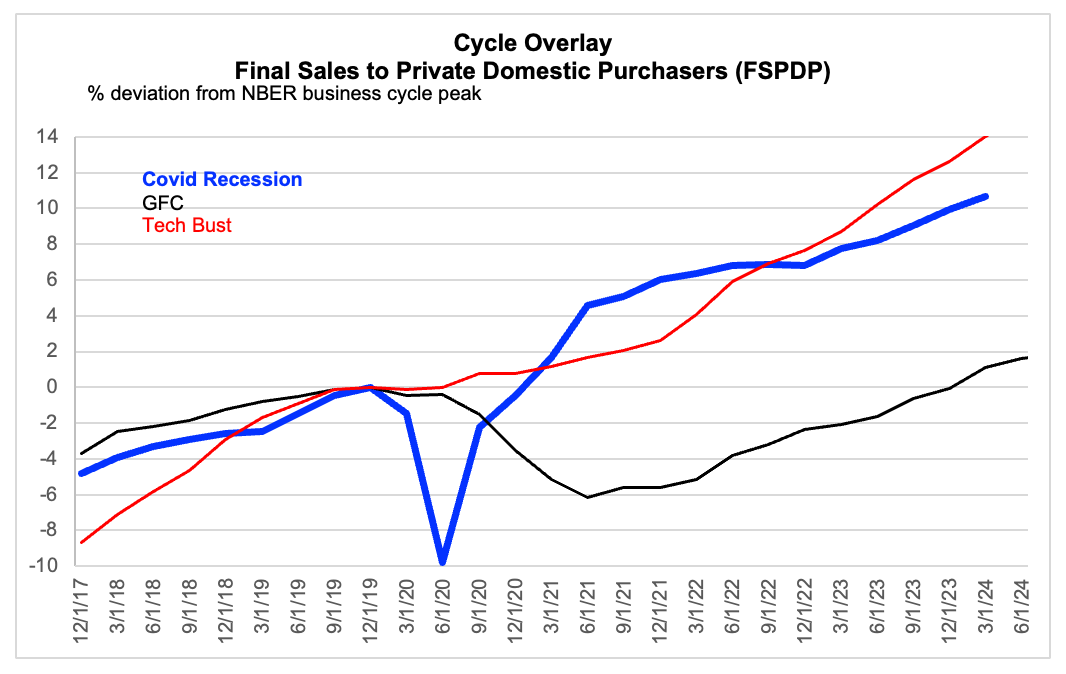
Data are actual to Q1 and estimated to Q2.
Dubious population estimates create a measurement issue
From a growth accounting perspective, it is not difficult to resolve this tension. The economy’s short-term potential growth rate has been lifted during the past two years by a spike in the population, driven by a surge of undocumented immigration. As a result, even 3% output growth has arguably been below-potential, which has allowed the unemployment rate to rise in a way that has been mostly helpful.
To the extent that the BLS data are missing the actual population surge, there are strong reasons to suspect that the household survey measure of employment growth is being understated, while the headline establishment survey is much closer to the mark. To understand this issue, it may be useful to surface a measurement issue that is often mentioned but perhaps not with enough emphasis to impress observers. The household survey does not attempt to measure the employment count directly. Rather, it polls households to estimate the shares of the employment that are in the labor force, employed, unemployed, etc. And then it prorates the surveyed employed share by an estimate of population – worked up elsewhere – to come up with the employment count. This contrasts it with the headline establishment survey, which estimates the job count directly, without reference to population estimates.
It has recently become widely accepted that this has created an issue with the household survey’s employment count, because the population estimates that the BLS applies to the surveyed ratios are missing the immigration surge. And the chart above shows one attempt to scale the effect of this. The panel on the left shows the (strong) job count from the establishment survey as well as an alternative count from the household survey, where the latter is put on the same definitional footing as the establishment survey, to allow a direct comparison, by eliminating farmers, counting multiple job holders twice, etc. The gap there has become alarmingly wide, raising suspicion that the establishment survey may be overcounting employment growth, possibly because of some issue with the birth / death model.
The simpler explanation though is that the employment estimates are too low, which brings us to the right panel of the chart. It adjusts the so-called “research” series to (my inferences from) a report to the Brookings Institute looking into the immigration issue. That report got a lot of attention, and I circulated it a few months ago as hinting at an intriguing likelihood. The correction I apply here is so “complete” that it may look as though I tweaked the data to achieve the result. In fact, I went with the most obvious inference and let the chips fall where they may. A more legitimate criticism, though, would be that the report I cite does find estimates of the population effect that are at the high end of what has recently become the consensus on this issue. In any event, the simulation shows that trying to take account of this issue can matter a lot, so we must dial down the importance we assign to the weakness in the household survey count of employment. As mentioned at the top of this note, this should be largely uncontroversial, at least directionally.
Assume faster population growth
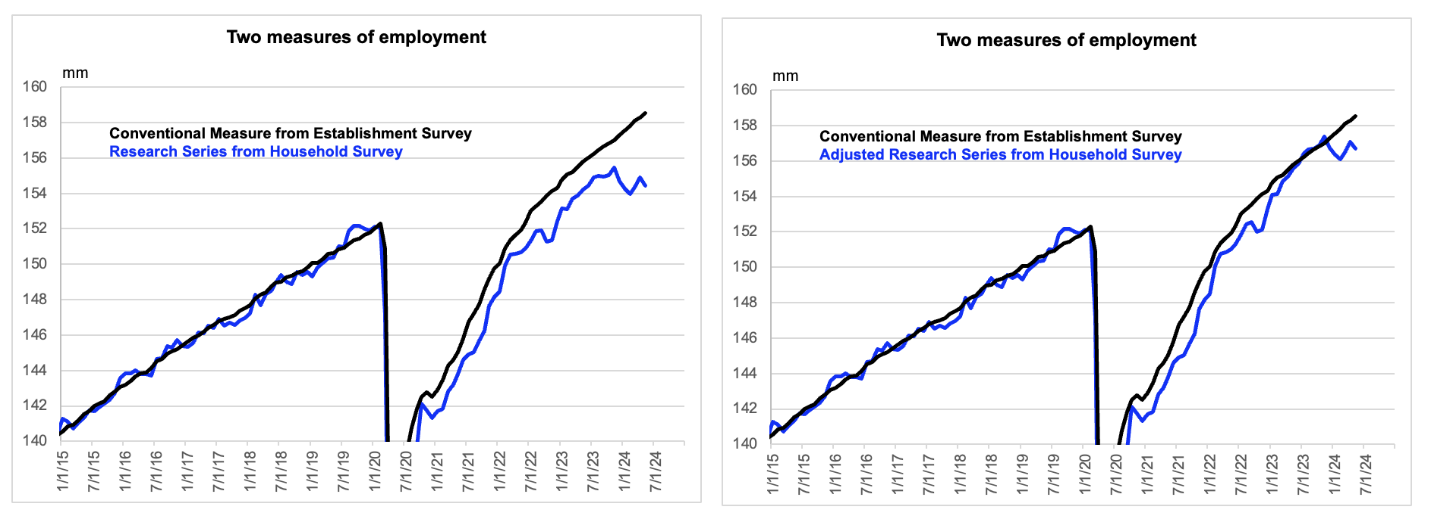
Underlying data are actual to May.
But there remains room for debate
The more practically important and disputable points involve questions related to the forecast. Recent growth momentum aside, what does the recently rising unemployment rate tell us about the state of the labor market, the outlook for inflation, and the effective stance of monetary policy? It will pay to keep an open mind on these issues and emphasize data watching over priors during the coming months. But my inclination is to lean hawkish here.
The doves like to insist that the trend to higher unemployment is effectively proof that the labor market is “cooling,” irrespective of the strength in employment growth and evidence of heat elsewhere on the demand side. For a high quality example of this take, you might want to read this take on the May employment report published on Friday by Employ America. For me, this was the money passage from Employ America:
For the question of “how hot is the labor market,” this discrepancy (ed note: which I have discussed above) is a little besides the point. As Jason Furman points out in a very clarifying thread, the pace of job growth alone does not tell us if the labor market is tight or not. What matters is whether or not we’re adding enough jobs to keep the labor market at its current level of tightness. The fact that the unemployment rate has steadily increased in recent months is a sign that we are not, and that the labor market is cooling.
Exhibit A for the doves
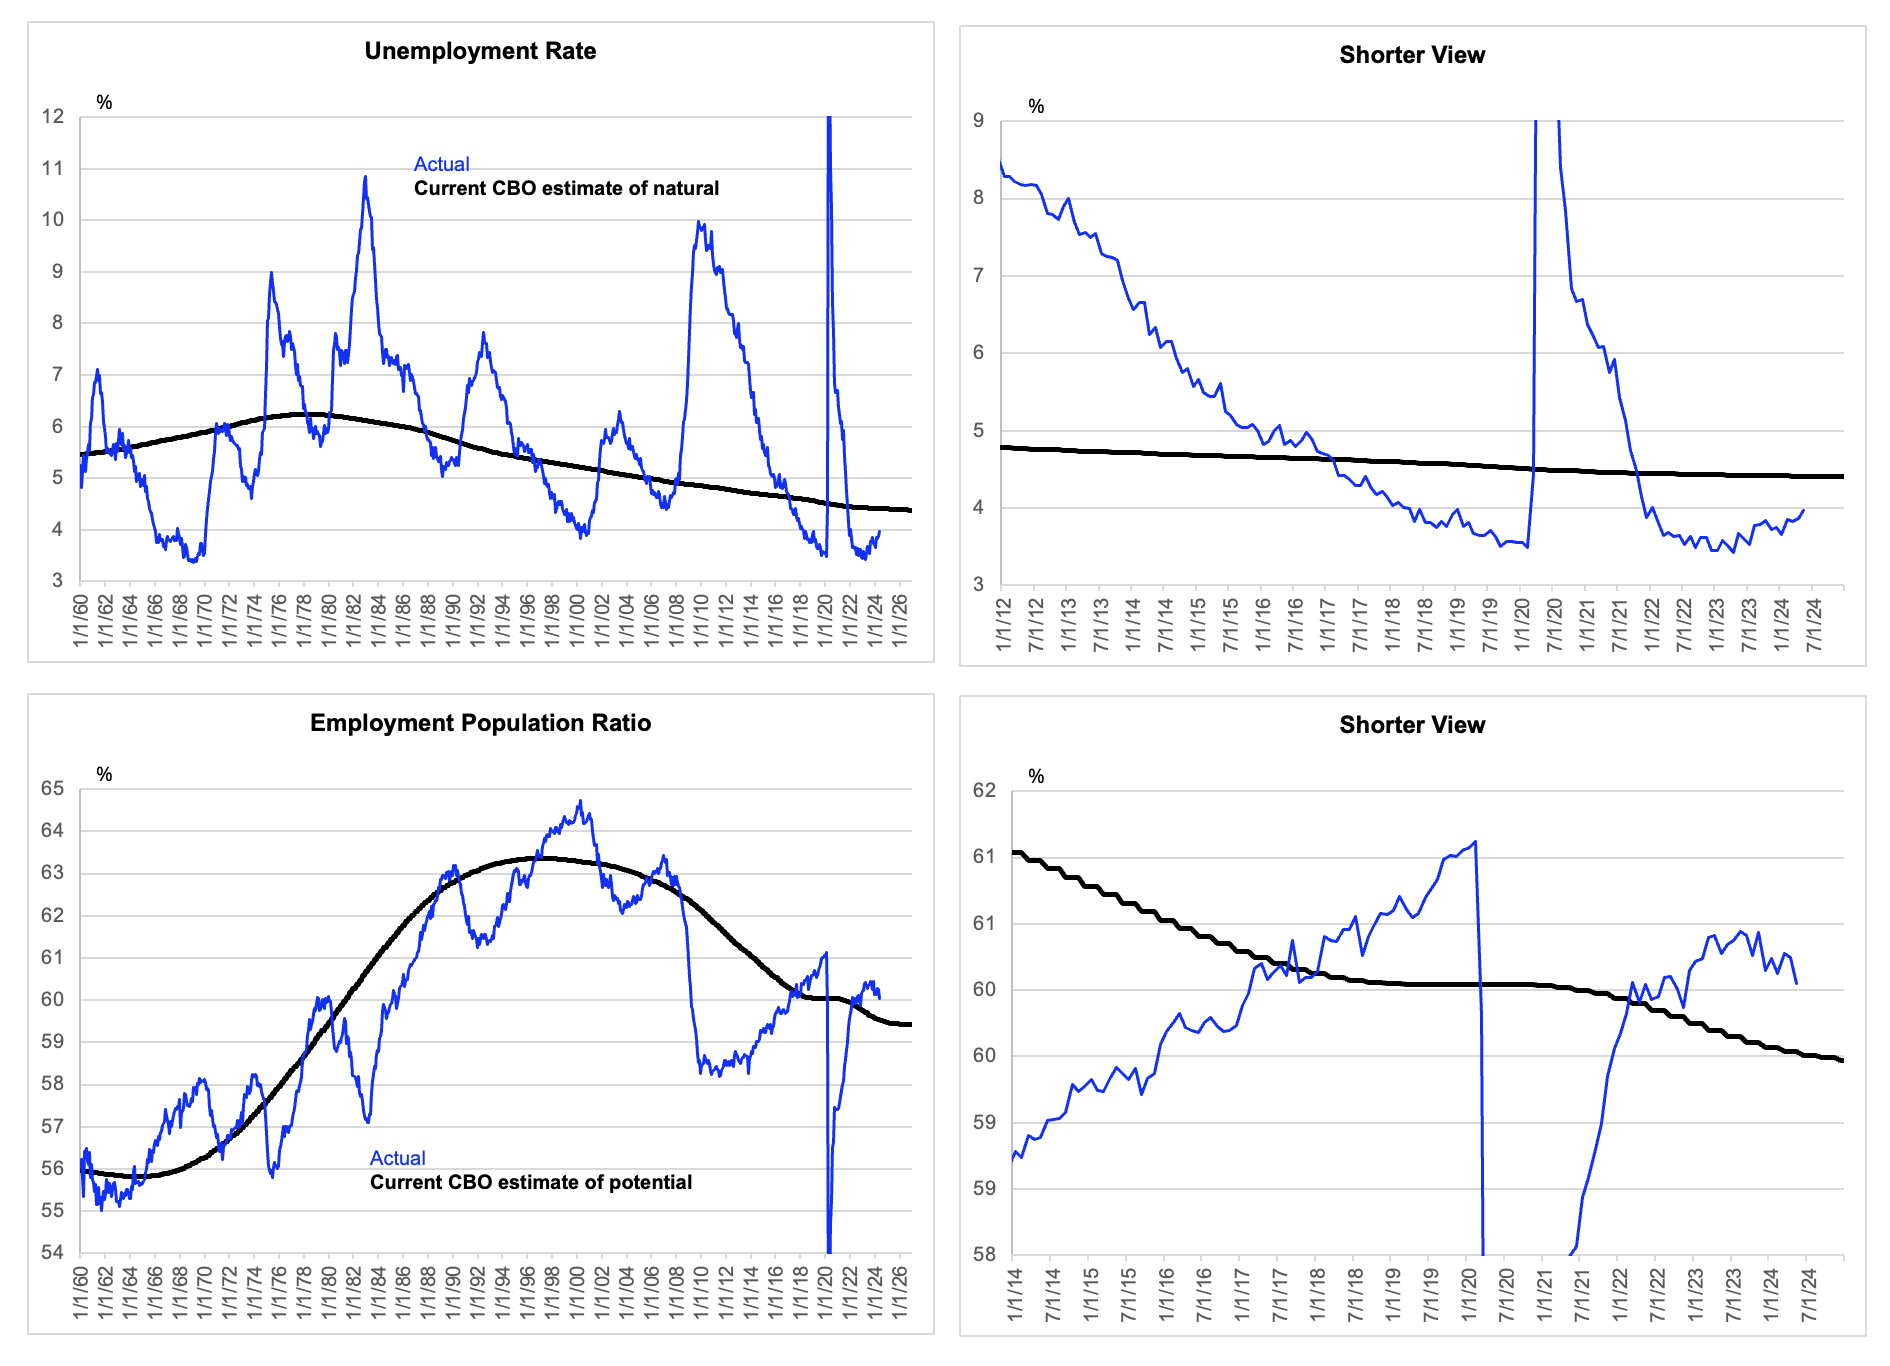
Labor market data are actual to May.
There is a sense in which the assertion above may be taken as a truism. If we define labor market heat as the level of the unemployment rate, then a rise of the unemployment rate will identify cooling. On the other hand, conventional macro does hold that a rising unemployment rate or declining employment / population ratio should signal reduced inflation pressures. The question is whether the inflation pressures have fallen enough. And I will return to that below.
The Employ America piece does not get into this directly, but please forgive me while I slip into my bad habit of mind reading. The doves often go further and suggest that a rising unemployment also signals the monetary policy must be effectively tight. After all, the most conventional way of estimating r*, and thus the gap between any r and r*, assumes that the stance of monetary policy operates directly on the output gap, rather than the demand growth rate itself. So, if the unemployment rate is rising, whatever the cause of that, then policy must be tight. For an accessible example of that line of thinking, you might want to take a look at this primer / estimation by Laubach and Williams. It is from almost a decade ago, but I think it incorporates current textbook thinking.
Uncertain but leaning hawkish
Inside the box thinking has been a decisive winner for the past 15 years now, although the hard-bitten sophisticates will never admit it. So, we might not want to wander too far astray. But there are a few reasons to lean to the hawkish side on this issue.
I guess the first point I would emphasize is the need to get into the right box. The gap between r and r* is a highly reduced way of even thinking about the effective stance of monetary policy. The more conventional approach is to relegate r* to longer term considerations, mostly relating to long duration assets, and to recognize that monetary policy affects demand growth by first influencing broader financial conditions. And at least as conventionally estimated, financial conditions have eased a lot during the past year, which is particularly striking given the – underappreciated – probability that a faster potential growth rate means that macroeconomic equilibrium, wherever it may be, will be associated with tighter financial conditions.
The most conventional measure of financial conditions does not seem to fit the script
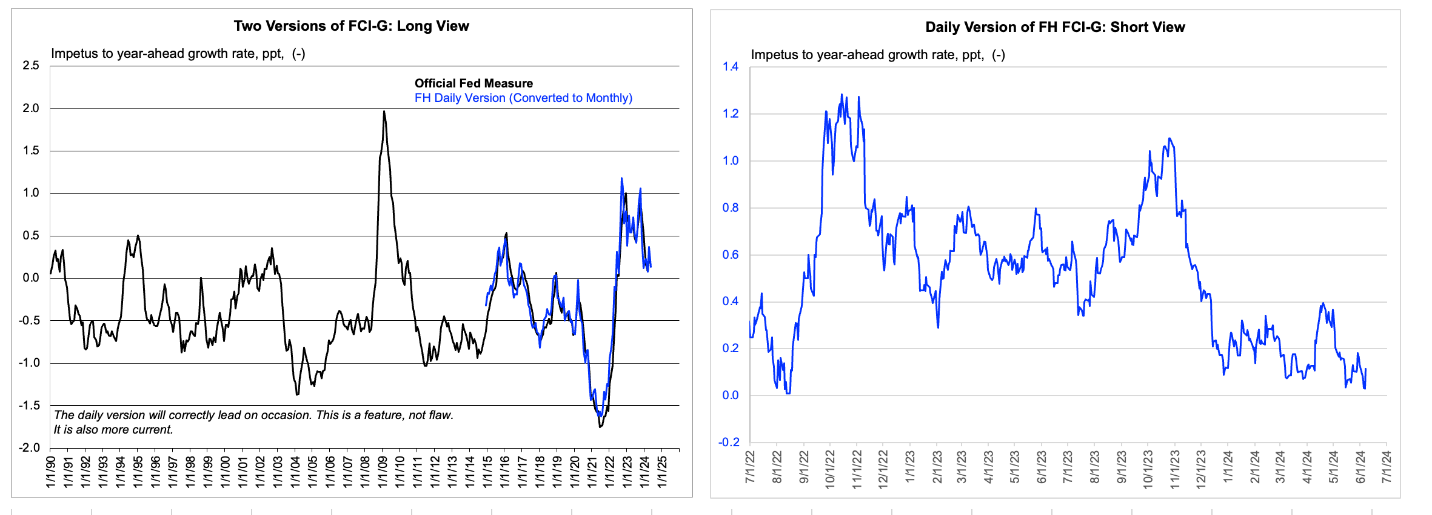
Official Fed index is actual to April. FH daily version of that is actual to Friday close.
The dove might insist that this is trumped by the fact that the unemployment rate has risen, which must mean that something has been tight, given the premise that the stance of monetary policy operates directly on the output gap. There is a logic to that, which I respect. But it is just one perspective, which could be challenged by invoking something as mundane as lags. For example, what if the impetus to aggregate demand growth from the immigrants outlasts their effect on the labor force? There is already evidence the immigration pulse may have been shut down, which I incidentally incorporate into the adjustments to the household survey above, incidentally. Entirely separately, it is at least conceivable that the data do not yet reflect the most recent easing, in which case the change of the unemployment rate would not be dispositive of where things are right now.
There is also the issue of how this relates to the Fed outlook, and in two separate ways. First, what would happen to financial conditions if the Fed were to deliver an ease, with demand growth booming, on the pretense that the economy’s speed limit has increased, as evidenced by the rising unemployment rate. Second and separately, the Fed’s aversion to directional changes in the path of the fund rate, which I have bemoaned many times in this space, means that the uncertainty around this issue probably goes to the hawkish take, at least for now.
Let’s conclude by returning to the question of whether the labor market has enough to secure a return to price stability. Again, the most conventional interpretation here would suggest that it has not quite. While the employment / population ratio has declined toward the most conventional estimates of its potential, the gap there remains an inflationary one. It is often pointed out that the Employment Gap is narrower than it was just before Covid, when inflation was not obviously an issue. But while there are reasons to suspect this framework, that criticism of it is incoherent. The reason is that the experience of the late 2010s is incorporated into estimates of the potential employment / population ratio (implicit in the estimated NAIRU and potential labor force participation rate). Double counting is not allowed.
That wage growth is lower than it was is hardly the issue, although this is not otherwise a slam dunk

Data are actual to May.
Another dovish argument is that the decline of wage growth over the past two years must mean that the labor market has eased a lot. It is now obvious that the labor market has eased somewhat, but we cannot draw a confident inference about whether it has eased sufficiently from the rate of change of wage inflation, or the so-called second derivative. And I confess to being bewildered why the dovish consensus is so breezily glib on this point. The spike of wage growth through early 2022 reflected a catch up to a goods and services price shock that did not originate in the labor market. Symmetrically, the recent decline of wage inflation has been driven mostly by a dissipation of that price shock and an associated catching down.
So, we cannot draw inferences about the change of the state of the labor market from the change of wage growth. Macro is tough and we all make mistakes, but surely, we can agree on the few bits of easy stuff. With lower conviction, I would point out that apparently sticky wage growth at a pace that seems to be consistent with 3% goods and services price inflation, for reasons I mentioned in notes last week, provides some confirmation that the labor market may still be a bit too tight. It is by no means certain, but this consideration does seem likely to slow the Fed.
We should be careful not to sound downbeat on this issue. It has been a major stroke of good luck, at least from a cyclical perspective, that surging immigration has overlapped with the apparent need for easier labor market conditions. That surge has allowed demand growth to remain strong and for the recession risk to be contained. And even from a monetary policy perspective, my own take is hardly alarmist. In many ways the current situation appears to be unbroken and not in need of fixing. Under the status quo – of a stubborn Fed – the labor market may ease further, and the last mile of disinflation may be achieved without much turbulence. It’s possible. And beyond this take on the central case, we should probably keep an open mind and be unusually receptive to the data flow. But we might want to lean a bit hawkish, particularly given that the Fed will for now probably interpret “ties” as favoring that approach.
[1] In fairness, there has been a range among the doves and hawks. Some doves conceded that the unemployment rate might have to rise somewhat; and some hawks appear to have radically overstated how much and abruptly the unemployment rate would have to rise.
[2] I do not get into the difference between growth as measured through the GDP and as measured through the GDI, because it was not a major issue during Q1 and there is no basis for a comment on Q2. During the second half of last year, relatively weak GDI may mean that the GDP growth rate was slightly overstated. In that case, the recent quickening has been a bit steeper.
[3] There is the question of the extent to which the surge of immigration has satisfied labor demand in the right sectors and at what level of relative productivity. I am assuming, along with the people I take to be experts on that issue, that this is a secondary consideration. One fun thought here, is that trend productivity is probably understated if that has been an issue. But I may return to this issue later.
[4] It has paid to be short the funds rate path, and yet financial conditions have stayed easy in part because hope has sprung eternal and in part because benign economic developments have supported risk assets and meant that tightening has had to be concentrated elsewhere.

