

By this point in the meeting cycle there is usually not much value in guessing how the Fed will surprise. Fed leaders are quite talkative these days, so the consensus going into the meeting is typically well informed. Perhaps it is best to remain silent and be fully objective about the new news when it comes.
In this note, I want to discuss a recent development in the US economy. The consumer spending boom that held throughout the second half of last year appears now to be abating, which will probably take down GDP growth. But the price data are finally providing some support to the view that the last mile of disinflation will be difficult. This is roughly the opposite mix of what had been in place for the past several months.
Warm inflation data recently
During the past month taken in isolation, these developments have arguably been a wash in terms of what will be required – and delivered – from the Fed. But the short term rates market was perhaps too committed to the view that they should extrapolate the earlier disinflation. So, to my eyes, it looks like they overreacted to the February price data, which have been warm, rather than hot. Given that the market earlier appeared a bit rich, this overreaction has allowed things to move to fair, or perhaps I should say, to a position that I find indistinguishable from fair. It is important not to overstate the recent news or its implication. Inflation is a factor slowing, not reversing the Fed, and it is not worrying enough to threaten the economic expansion.
The Fed targets the medium to longer-term outlook for the headline PCE deflator. And it monitors progress toward that target by observing the core deflator and various slices of it, including what has recently become known as the Powell Supercore. The individual price detail within the CPI has an influence on the best guess of the deflator to be released two weeks hence. But beyond that, it is probably about right to treat the CPI as irrelevant. Certainly, it is unhelpful to take an “average” of what the core CPI and PCE deflators are showing. So, let’s start here by refreshing on how the consensus estimates (some of which are implicit) for the core deflator gain in February are shaping up. I sent this detail out earlier but without interpretation.
Consensus February estimates following the CPI and PPI releases
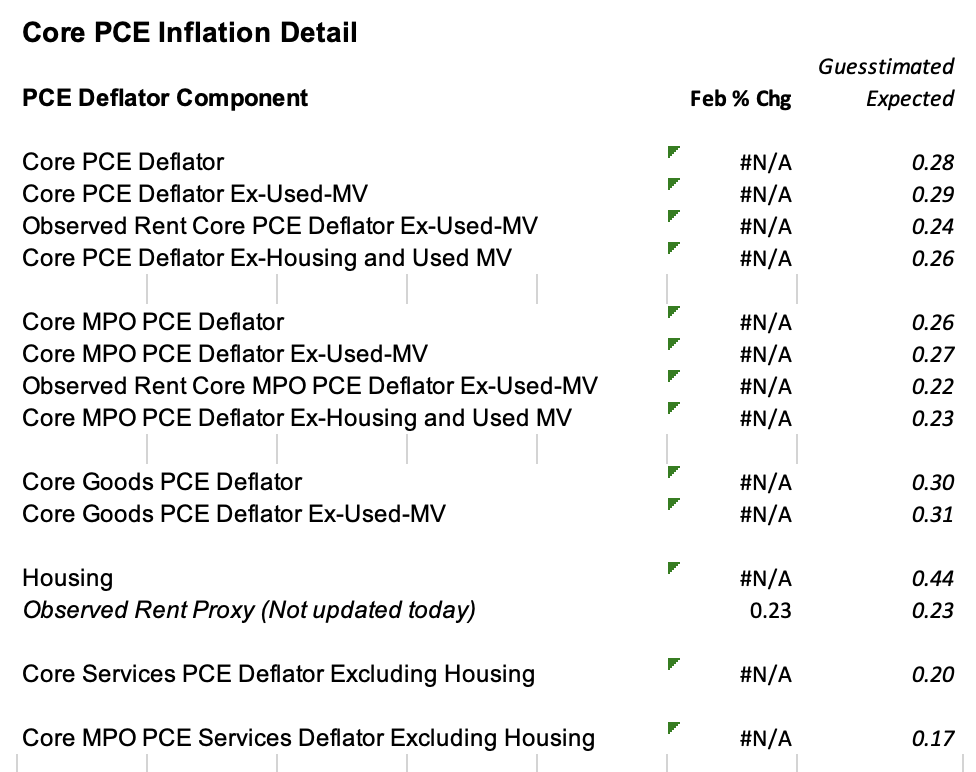
Estimates are for February.
There are a lot of figures in the table above. Many of them are for readers who might be curious in different slices than I am. But the interesting thing about this month is that the moderately warm gain of the core PCE deflator was not influenced by non-market prices and was concentrated in the goods, rather than services, sector, which is new. The core goods PCE deflator is slated to be up 30 basis points in February, which is 40 to 50 basis points higher than its recent trend, expressed at a monthly rate. But the so-called Powel Supercore, shown second from bottom in the table, is expected to be up just 20 basis, one third of the actual gain last month.
Implication of consensus estimates for key underlying trends

Data are actual to February and consensus, in some cases implicit, for February
The chart above shows how these consensus estimates would map to the 3- and 12-month growth rates for key measures of underlying PCE inflation, if the consensus were to be confirmed and if the revisions to the back data were confined to the minor implications of recent changes in the PPI data. The strength of core goods price inflation during February took the 3-month rate of change there from -2% to 3%, which alone adds 25 bps to the 3-month rate of core PCE inflation – in a single month. On the other hand, the earlier fright in the Powell Supercore has abated. The pattern there now looks like a stabilizing one, rather than an accelerating pattern. On the chart the idea of acceleration may not seem that obvious. But it would have been obvious had the February data (so far) come in neutral, rather than very friendly. And we should probably overweight the trend in this component because goods price inflation can be fickle and dominated by external developments and because the housing component of PCE inflation is a bit dubious, for reasons that have been well established in consensus during the past couple years.
Two-stage middle-up inflation
People are interested in these slices of core PCE inflation because the momentum within them might provide some guide to the outlook for inflation, which most concerns markets, partly because it most concerns the Fed. So, in the table above, I update my Middle-Up six-month inflation forecast to incorporate the trends that seem to be in place, the most important of which is the arguable stabilization pattern in the Powell supercore. The table mostly speaks for itself but let me give a brief rationalization – or perhaps just description- of each component.
- Core goods price inflation moderates to -1% (ar). This is a slower pace of deflation than when the renormalization of the relative price was ripping, in part because that renormalization is more advanced and in part because changes of the global supply change are less friendly. The forecast is that goods price deflation is just slightly quicker than “normal.”
- Core services ex-housing inflates at a rate of 3.7%. This is the same value as the 3-month rate of the Market Price Only (MPO) version of the Supercore. And I use that measure as the best guide of momentum here. But implicit in using it is the notion that underlying inflation here slips by about 25 bps, which is the typical gap between standard and MPO services inflation, which we do not want to strip out when forecasting. Or in English, I project that the Powell Supercore slows just 25 bps from its recent trend. It proves “sticky” in that sense.
- The PCE housing deflator is expected to gain an average of 35 bps a month over the next six months. That annualizes to 4.3%, which is a nice step down from the 5.8% rate during the six months to February. So, I am definitely not extrapolating the recent stabilization pattern there, because I lean heavily on my own priors.
This simulation implies that overall core PCE inflation runs at a sequential annualized rate of 6% during the next six months. And if that were confirmed then slightly adverse base effects would prevent the 12-month core PCE inflation rate from changing at all from its (estimated) rate of 2.8%. Nor would there be much further decline to December if I were to extrapolate further. But I don’t want to do that because I want to stay focused on one horizon.
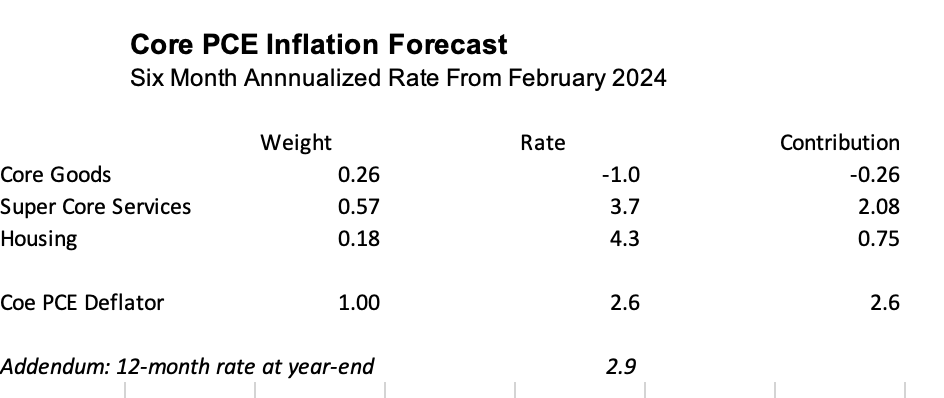
But what of the Observed Rent core PCE inflation rate? We can easily simulate that by inserting my estimate of marginal rent growth, 2.25%, in for the government data, which systematically lag. Observed Rent inflation would slow slightly to a sequential rate of 1.8%, slightly below the Fed’s target. Keep in mind that the Observed Rent core inflation rate is already quite low. But it still matters quite a bit whether we follow the outlook for the core deflator or the Observed Rent version of it.
My own view is that the consensus is too dismissive of low marginal rent growth, and so I put a higher than typical weight on the Observed Rent figures. I used to be more adamant about this, but it is tougher for the Fed to make “excuses” when the Supercore is looking sticky (as now), rather than disinflating rapidly (as earlier). And I have noticed that they are not.
Consumer spending boom has abated
Moving on to real growth, it appears as though the earlier consumer spending boom is abating and that the consensus is to the high side of what is likely here for the first time in a long while. The monthly gain of retail sales during February was moderate and mostly inline. But revisions in the historical data and the slight decline in the auto SAAR for February mean that Q1 real PCE growth is now tracking at about 1 ½%. This compares with an estimate of 2% to 2 ½% that would have been appropriate just a few weeks ago. And it would be a big step down from the 3% growth recorded in Q1.
Underlying real income growth looks to be running at about 2%, although this too is a bit of a stepdown. And I don’t think there is any case for the personal saving rate “wanting” to rise at the current level of financial conditions (which the consensus obviously now accepts). So, it seems inappropriate to forecast an actual faltering of real PCE or a major downgrade to the economic outlook resulting from that. But the less boomy conditions here seem to be one reason not to press a short view in rates at current pricing. I would rather write about the offsetting detail in a way I hope might help your own thinking.
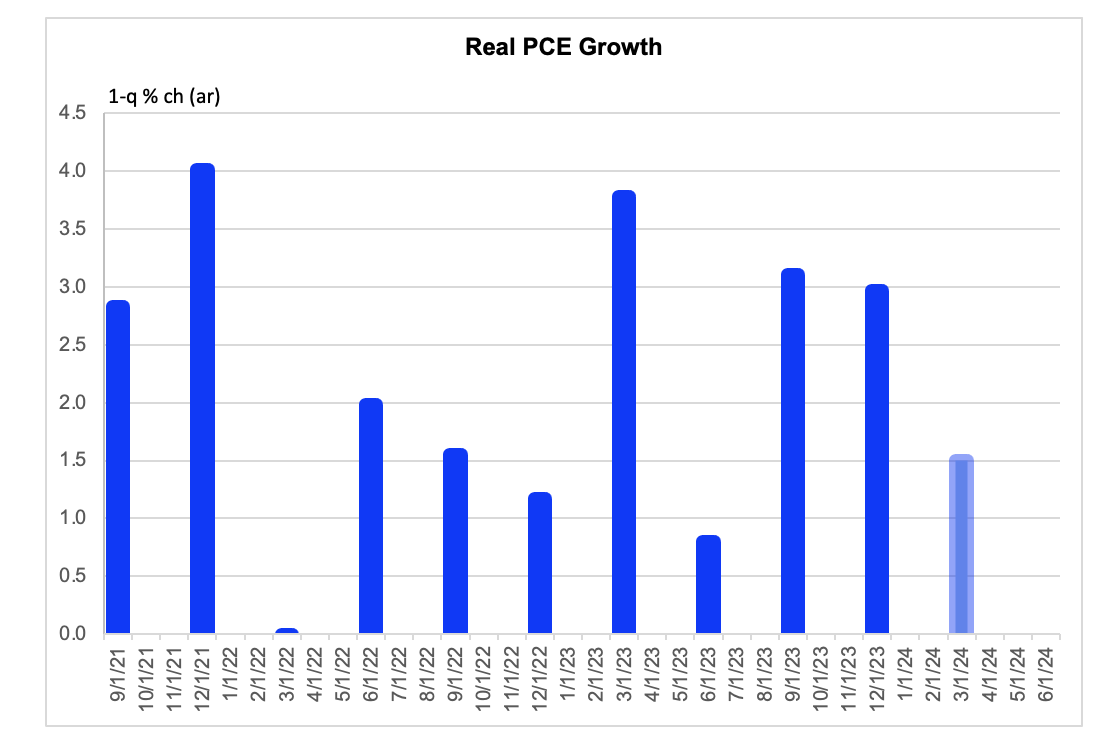
Data are actual to Q4 and tracking estimate to Q1.
[1] Specifically, the 12-month rate of the core would fall to 2.7% by December, just slightly above the fourth quarter estimate of 2.4% in the Fed’s December SEP, which will be updated on Wednesday. To get the Fed’s quarterly guess, which is slightly different from the 12-month rate, would require sequential inflation of exactly 2.5% (ar) during the 10 months from February to December.

