It was 1984 when the English New Wave band Depeche Mode released the song, Blasphemous Rumors. The song’s lyrics were thought a bit scandalous because the band questioned God’s behavior and wisdom. Altered for my purposes, the changed lyrics may be thought a bit scandalous today, too, because I’m suggesting investors are not likely prepared for what I see as a coming change in the market’s behavior.
I don’t want to start
Any blasphemous rumors
But I think the market’s
Got a sick sense of humor
And when I die
I expect to find it laughing.
The weekly chart below shows my Growth / Non-Growth Ratio which is two ETFs in the numerator (XLK + XLY) divided by four ETFs in the denominator (XLB + XLE + XLF + XLI) with a corresponding MACD momentum indicator. I thought about the Growth to Non-Growth (or Growth to Value if you prefer) relationship yesterday – principally thinking that the market is moving into a scenario where Non-Growth (Value) will outperform Growth – while talking Sector performance with Kim Wallace, 22V’s Washington Policy cognoscente. For example:
1 The Jan ‘23 – Feb ’24 outperformance rally for Growth over Non-Growth was +42% over 57 weeks which is not that different, when adjusted for length of advance, with what happened when the ratio gained 23% over 27 weeks from May ’21 – November ’21.
2 In this part of the cycle MACD momentum peaked in July ’23 well ahead of the now obvious lower high in MACD momentum which occurred in February ’24 (see LH for Lower High in the bottom panel). What’s occurring now is not an identical replay to what was seen in 2020, but MACD momentum peaked five months before price did (May ’20 vs. Oct ’20) and this time MACD momentum peaked seven months ago (July ’23 vs. Feb ’24).
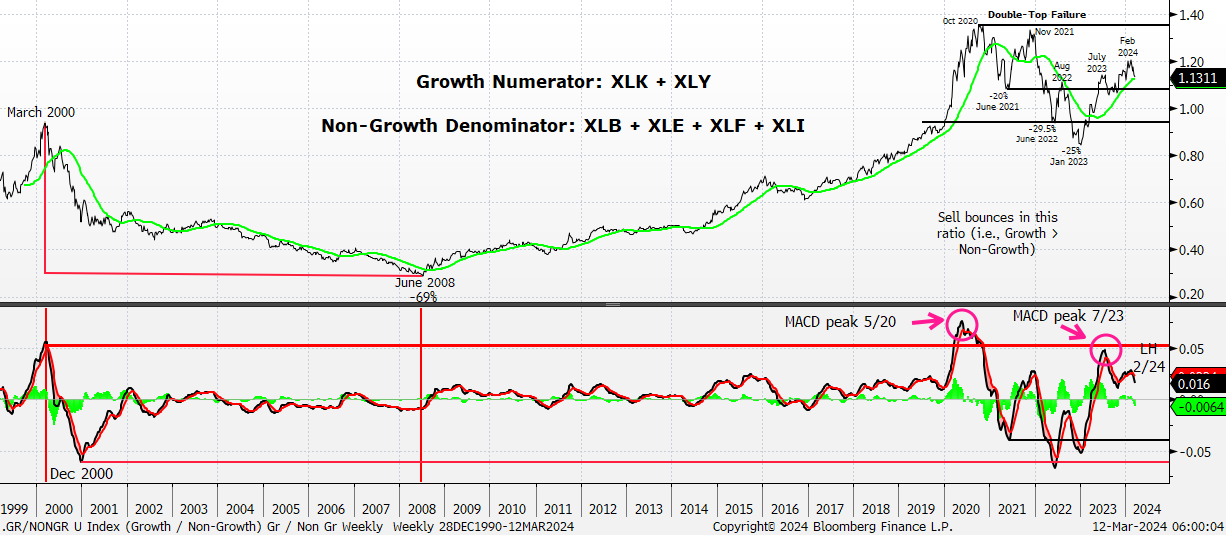
3 In the 20 weeks since the S&P’s low / market’s turn from October 27, 2023, while the Growth component of my ratio added 28% and beat the Non-Growth component’s 20%, both Growth and Non-Growth have each won in the weekly competition 10X. So, while Growth gets all the attention (rightfully so given 800bp of outperformance over 20 weeks), Non-Growth deserves more respect than it gets / has gotten given that it is tied Growth for the number of weekly wins. To make matters more interesting, Non-Growth has beaten Growth in 9 of 15 weeks from Dec 1, 2023 – Mar 8, 2024 and the relative ratio between the two is flat over this time frame. This is the reason a lower high has developed in the MACD telling us of the change in momentum from Growth to Non-Growth.
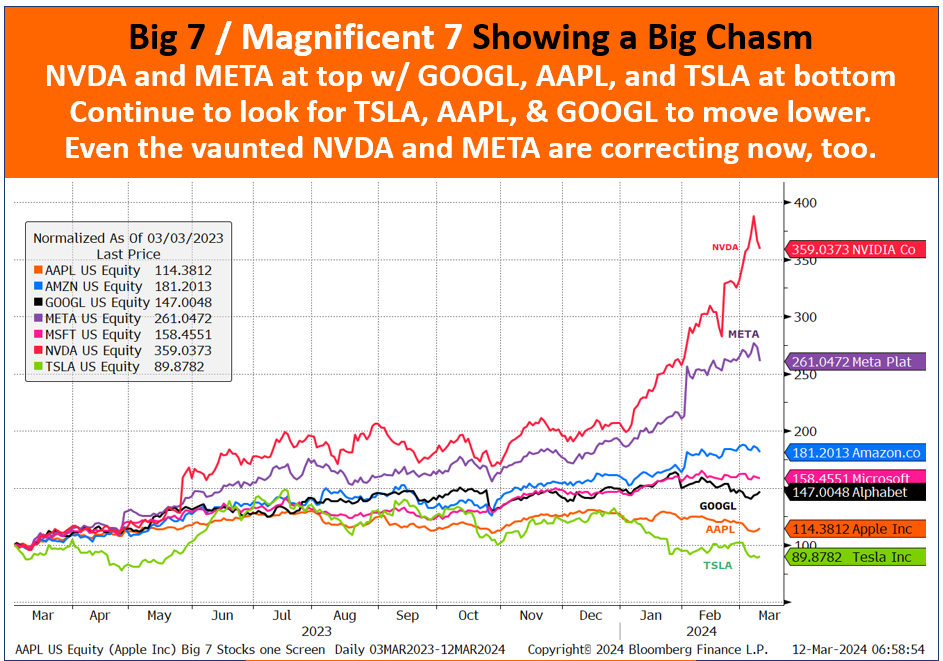
4 The loss in momentum for Growth might simply be explained via the following charts. The first one shows the stocks that comprise the Big 7 making explicit mention of the Big Chasm between NVDA and META and TLSA, AAPL, GOOGL, MSFT and AMZN. This chart appears in my weekly chart packets / Webinar chart packets / presentation chart packets and makes clear that price action for these Big 7 stocks is no longer monolithic.
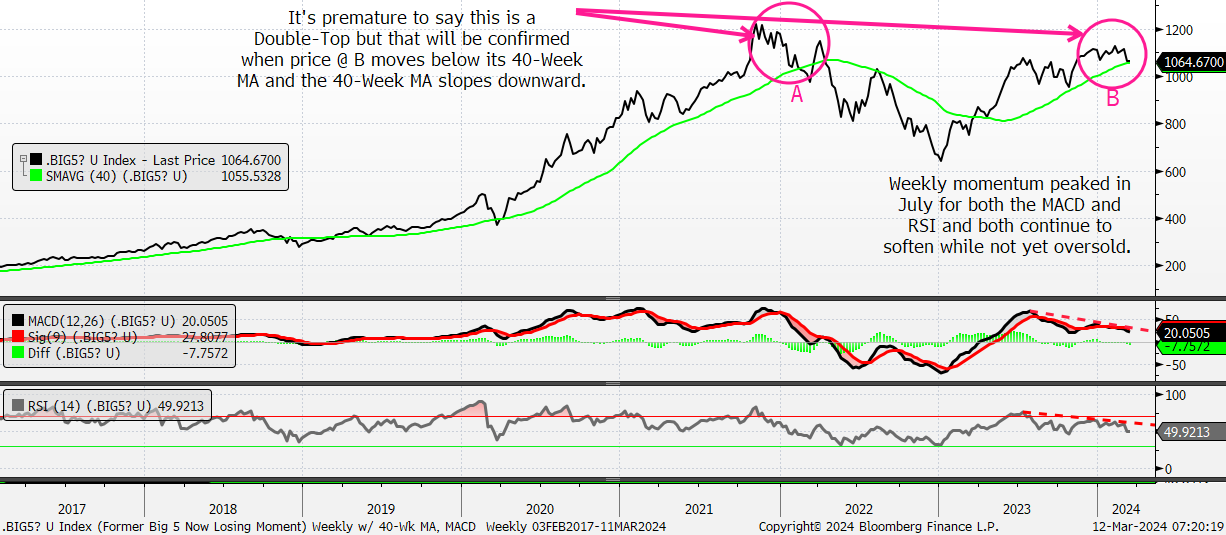
The second chart is an index comprised of the Big 7 stocks not named NVIDIA and Meta: AMZN + MSFT + GOOGL + AAPL + TSLA. Please notice the following: Weekly momentum, via the MACD in the middle panel and RSI in the bottom panel, peaked in July ’23 (same as it did for the Growth / Non-Growth Ratio in the first chart at the top of this note) and it continues to soften while not yet oversold.
It is a bit premature to say the price action shown in the top panel is a Double-Top but I think that will be easier to conclude when price @ B moves below its 40-Week MA and the 40-Week MA slopes downward. I’m figuring that happens given the MACD and RSI readings.
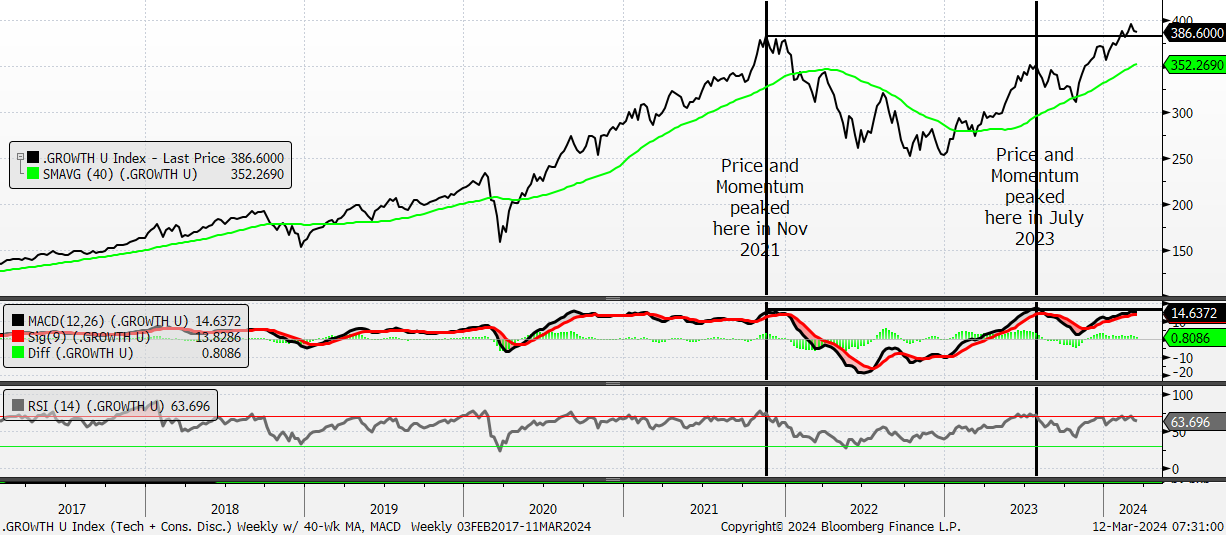
5 The next weekly chart shows the Growth side of the ratio. It’s true that the combined price action for the XLK + XLY made a recent new high above its late 2021 high so I’m willing to give the new high the benefit of the doubt here. However, the new high has occurred with overbought readings for both the MACD and RSI that are like those seen in November 2021 and July 2023. History doesn’t have to be repeated in detail, but I think it is more likely we see momentum soften next akin to what we saw at the two prior periods highlighted in the chart.
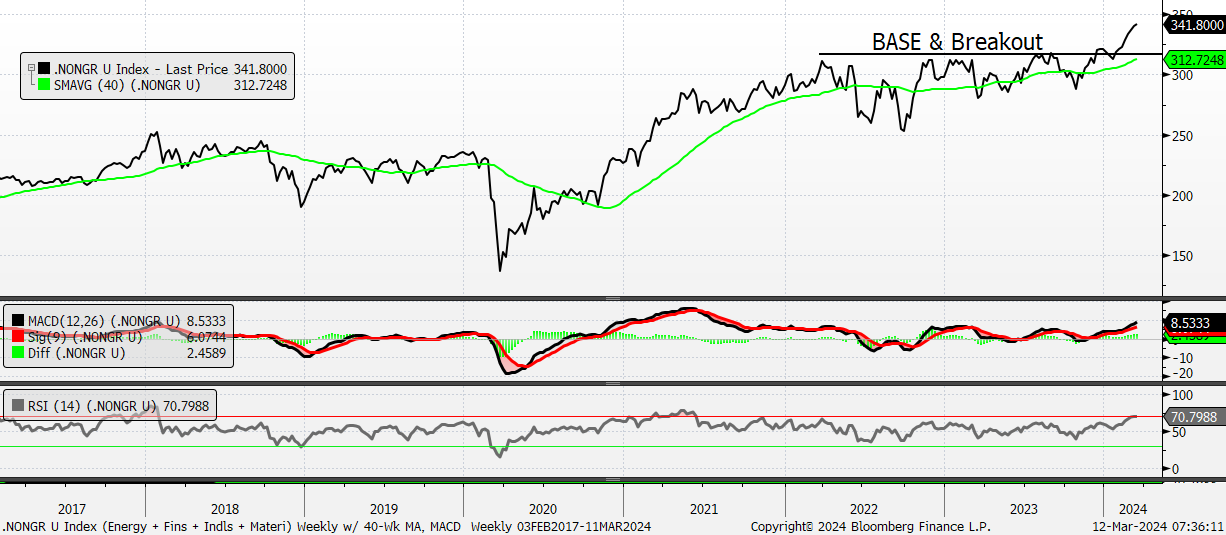
6 Meanwhile, the Non-Growth side of the ratio shows, I believe, a more impressive breakout from a near 2-year BASE. Like momentum for the Growth index in the prior chart, the MACD and RSI indicators are also overbought so I think it’ll be hard for Non-Growth momentum to accelerate but that doesn’t have to happen for Non-Growth to outperform Growth which is what I’m speculating will occur next.
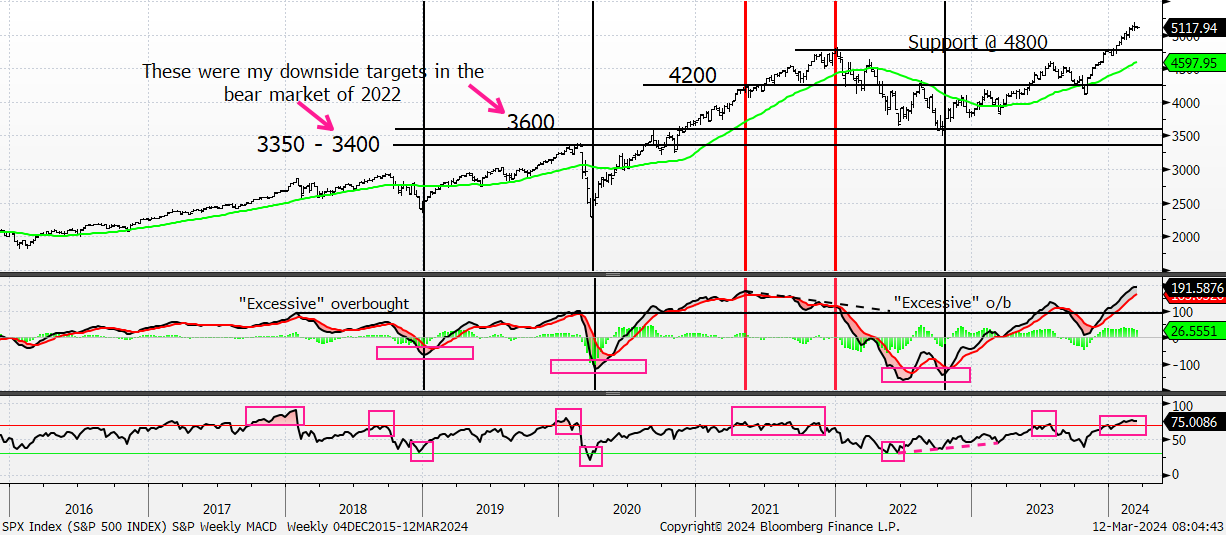
 7 I know that the natural inclination, after working through the above, is to have an opinion on what the S&P will do next. Suffice it to say that it wouldn’t surprise me – and it shouldn’t surprise you, either – to see the S&P pull back given its excessive MACD overbought reading and somewhat “lengthy” RSI overbought reading, too. But we should also consider that the market’s rally since the October low has been quite broad so I would suspect that, even with underperformance by Growth Relative to Non-Growth, pullbacks should be light.